- Page 1 and 2: 60 Avances DE INVESTIGACIÓN Sistem
- Page 3: Sistemas productivos locales en Mé
- Page 7: PROLOGO El estudio de las crisis ha
- Page 11: INTRODUCCIÓN El cruce de las teor
- Page 15 and 16: 2. MARCO CONCEPTUAL Y ANALÍTICO 2.
- Page 17 and 18: Las aglomeraciones de empresas tien
- Page 19 and 20: Las estrategias territoriales lleva
- Page 21 and 22: k. Relaciones con las diversas esca
- Page 23 and 24: 3. RESULTADOS DE LA INVESTIGACIÓN
- Page 25 and 26: capacidad e importancia que en la f
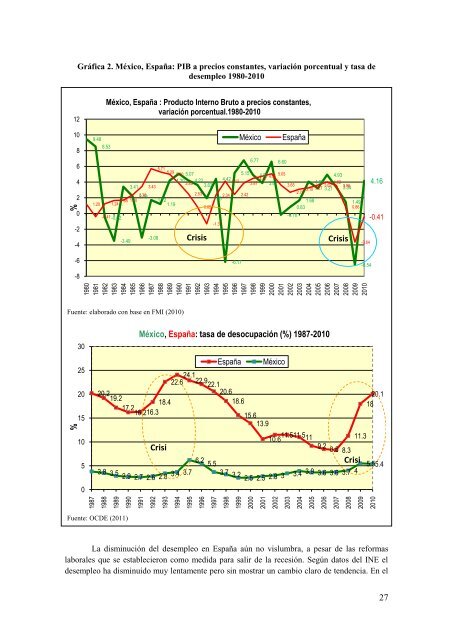
- Page 27: Si bien una característica de la a
- Page 31 and 32: esultados, el coeficiente de export
- Page 33 and 34: fundamento en el propio proceso de
- Page 35 and 36: A partir de la reestructuración ec
- Page 37 and 38: En el caso de México cabe destacar
- Page 39 and 40: Gráfica 3. México, España: gasto
- Page 41: 3) “Sistema productivo Local”,
- Page 44 and 45: desarrollo de factores especializad
- Page 46 and 47: Otro aspecto que influyo positivame
- Page 48 and 49: En ambas tecnologías convergen dis
- Page 50 and 51: Gráfica AG 1. España: porcentaje
- Page 52 and 53: Respecto de la industria de la cons
- Page 54 and 55: Gráfica AG 4. España: empresas de
- Page 56 and 57: Tabla AG 4. México: principales cu
- Page 58 and 59: considerada como un agrodistrito y
- Page 60 and 61: Gráfica AG 6. México, España: co
- Page 62 and 63: 4.2 Organización de la división d
- Page 64 and 65: específico de mercado. Los problem
- Page 66 and 67: los productos ecológicos, para lo
- Page 68 and 69: universitarios, servicios financier
- Page 70 and 71: importante esta en propiedad intele
- Page 72 and 73: Respecto de las estrategias de inno
- Page 74 and 75: Los ámbitos de estudio tienen cara
- Page 76 and 77: No. Empresa % de Mercado Tabla AG 7
- Page 78 and 79:
Tabla AG 8b. España: resumen empre
- Page 80 and 81:
costos de transacción, la innovaci
- Page 82 and 83:
En el caso de España, se utilizan
- Page 84 and 85:
En México, la clase Fabricación d
- Page 86 and 87:
Las comarcas mencionadas del sur de
- Page 88 and 89:
Gráfica C2. España: empresas de c
- Page 90 and 91:
En conclusión la cerámica tradici
- Page 92 and 93:
especializarse en alguna etapa, con
- Page 94 and 95:
El SPL de Dolores está asentado en
- Page 96 and 97:
de cerámica españolas dirigen sus
- Page 98 and 99:
calidad media-alta en servicio vaji
- Page 100 and 101:
No . 1 2 santa rosa 3 Empresa Giro
- Page 102 and 103:
No. Fuente: elaboración propia 1 E
- Page 104 and 105:
Criterios para definir temperaturas
- Page 106 and 107:
El desarrollo de la producción de
- Page 108 and 109:
ajo su control la producción texti
- Page 110 and 111:
el desarrollo de una mayor producci
- Page 112 and 113:
2.1 Descripción del sector El sect
- Page 114 and 115:
Al comparar ambas clasificaciones,
- Page 116 and 117:
Las tendencias anteriores se pueden
- Page 118 and 119:
Gráfica T5. México, España: part
- Page 120 and 121:
Tabla T5. México: composición de
- Page 122 and 123:
En México, la competencia de los p
- Page 124 and 125:
Puebla y sus alrededores (el munici
- Page 126 and 127:
Gráfica T 7. Regiones Textiles en
- Page 128 and 129:
4. Empresas El siguiente análisis
- Page 130 and 131:
Algunas de las empresas grandes han
- Page 132 and 133:
4.3 Maquinaria, equipo y proceso te
- Page 134 and 135:
noventa del siglo XX tuvieron en mu
- Page 136 and 137:
En las últimas tres décadas la in
- Page 138 and 139:
En cuanto al empleo en ambos paíse
- Page 140 and 141:
No. Empresa 1 Textiles Morales S.A.
- Page 142 and 143:
No. Empresa Equipo tecnológico 1 B
- Page 144 and 145:
Tabla T 2.Comparación de la clasif
- Page 146 and 147:
144
- Page 148 and 149:
ensambladoras, e indirectamente al
- Page 150 and 151:
de vehículos; apoyos en materia de
- Page 152 and 153:
en los dos focos industriales: el P
- Page 154 and 155:
Ford II y el ministro López de Let
- Page 156 and 157:
México, como son algunos modelos d
- Page 158 and 159:
2. Sector La sucesión de paradigma
- Page 160 and 161:
industria Terminal y donde figuran
- Page 162 and 163:
De esta forma, se genera una depend
- Page 164 and 165:
Tabla AU2. Clasificaciones que corr
- Page 166 and 167:
Gráfica AU3. Producción y tasa de
- Page 168 and 169:
La evolución de las exportaciones
- Page 170 and 171:
unidades por mil trabajadores Gráf
- Page 172 and 173:
Tabla AU8. México: capacidad del d
- Page 174 and 175:
Valle de México por que las empres
- Page 176 and 177:
Tabla AU5 . Principales empresas de
- Page 178 and 179:
de todo tipo. En Cataluña, el sect
- Page 180 and 181:
Gráfica AU 9. Regiones Automotrice
- Page 182 and 183:
4. Empresas En este apartado se pre
- Page 184 and 185:
público -Comforsa-). Algunas empre
- Page 186 and 187:
manera, los proveedores de VW son l
- Page 188 and 189:
Asociación Española de Fabricante
- Page 190 and 191:
4.9 Estrategias ante la crisis Para
- Page 192 and 193:
fueron: 1) caída de la producción
- Page 194 and 195:
Empresas de Autopartes en México L
- Page 196 and 197:
1 2 Empresas de Autopartes en Espa
- Page 198 and 199:
costos bajos de China. Por lo que l
- Page 200 and 201:
Tabla AU6 (continuación) Karmman-G
- Page 202 and 203:
Tyco (2) (UK) TIER 2 Montcada i Rei
- Page 204 and 205:
incorporado en el hardware, a parti
- Page 206 and 207:
Como se describía, el factor clave
- Page 208 and 209:
En México, la industria del softwa
- Page 210 and 211:
La adopción de modelos de certific
- Page 212 and 213:
212
- Page 214 and 215:
3. Región. La actividad del softwa
- Page 216 and 217:
Gráfica S1. México: empresas de l
- Page 218 and 219:
Gráfica S 2. España: concentraci
- Page 220 and 221:
4. Empresas. En este apartado se es
- Page 222 and 223:
comportamiento de los servicios que
- Page 224 and 225:
los bancos quienes han financiado e
- Page 226 and 227:
Gráfica S4. México, España: tipo
- Page 228 and 229:
con mejores comunicaciones y cercan
- Page 230 and 231:
1 2 Promoción y Operación PROSA C
- Page 232 and 233:
Número Empresa Fuente: Elaboració
- Page 234 and 235:
3.3 Análisis comparativo Con base
- Page 236 and 237:
4) El Clúster ubica un conjunto am
- Page 238 and 239:
3.3.2 Innovatividad de las empresas
- Page 240 and 241:
3.3.3 Empresas en España y México
- Page 242 and 243:
Sector Aglomeración Difusión del
- Page 244 and 245:
Gráfica 3 Textil Gráfica 4. Méxi
- Page 246 and 247:
SECTORES Agroind (alimentaria ) Cer
- Page 248 and 249:
CONCLUSIONES La comparación por se
- Page 250 and 251:
cargada a la producción). Sin emba
- Page 252 and 253:
252
- Page 254 and 255:
http://pioneer.netserv.chula.ac.th/
- Page 256 and 257:
FMI (2011) World Economic Outlook D
- Page 258 and 259:
Terracotta museu http://www.Labisba
- Page 260 and 261:
ITAM, (2004), ―El sector autopart
- Page 262 and 263:
http://www.garridocordobera.com.ar/
- Page 264 and 265:
264
- Page 266 and 267:
Anexo2 ÍNDICE INDICO Índice Índi
- Page 268 and 269:
Anexo 3 CUESTIONARIO SISTEMAS PRODU
- Page 270 and 271:
G 2.4 ¿Cuál es el motivo de sus i
- Page 272 and 273:
3.3 Los tres impactos más importan
- Page 274 and 275:
5.4 ¿Cómo se distribuyen en los m
- Page 276 and 277:
ÍNDICE INDICO PREGUNTAS Puntos RES
- Page 278 and 279:
T8b. México: resumen de las empres
- Page 280 and 281:
AU11. España México: Distribució