- Page 1 and 2:
VOLUME 1
- Page 3 and 4:
Livro Actas ACTAS Comissão Executi
- Page 5 and 6:
Livro Actas Oradora - Profª M. Ros
- Page 8 and 9:
INDICE Corinne ROMAND; Emilie CARRO
- Page 10 and 11:
ESTABILIZAÇÃO PROTEICA DE VINHOS
- Page 12:
CARACTERIZACIÓN DE NUEVAS LEVADURA
- Page 17 and 18:
Livro Actas diseases is useful for
- Page 19 and 20:
Livro Actas The advantages of ELISA
- Page 21 and 22:
Livro Actas 4 - Loop-mediated isoth
- Page 23 and 24:
Livro Actas References Boonham, N.,
- Page 25 and 26:
Livro Actas Apesar de no mundo vit
- Page 27 and 28:
Livro Actas Ao longo do processo de
- Page 29 and 30:
Livro Actas as castas Síria e Rabo
- Page 31 and 32:
Livro Actas Figura 1 - GGE Biplots
- Page 33 and 34:
Livro Actas portanto, a técnica do
- Page 35 and 36:
Livro Actas clones de vigne. In: Ac
- Page 37 and 38:
Livro Actas 1 - INTRODUÇÃO ‘Alf
- Page 39 and 40:
Livro Actas das” de ‘Alfrocheir
- Page 41 and 42:
Livro Actas 250 SNPs analisados) co
- Page 43 and 44:
Livro Actas castas enumeradas leva-
- Page 45 and 46:
Livro Actas MENEZES P. (1896) Apont
- Page 47 and 48:
Livro Actas Tejo, Sado e Guadiana.
- Page 49 and 50:
Livro Actas 2.5 - Análise de dados
- Page 51 and 52:
Livro Actas REFERÊNCIAS BIBLIOGRÁ
- Page 53 and 54:
Livro Actas 1 - INTRODUÇÃO Ao lon
- Page 55 and 56:
Livro Actas Quadro 1 - Caracteriza
- Page 57 and 58:
Livro Actas fenólicos da casta Tou
- Page 59 and 60:
Livro Actas Para a intensidade da c
- Page 61 and 62:
Livro Actas REFERÊNCIAS BIBLIOGRÁ
- Page 63 and 64:
Livro Actas turais em função do e
- Page 65 and 66:
Livro Actas as variedades por forma
- Page 67 and 68:
Livro Actas Tabela 2 - Parâmetros
- Page 69 and 70:
Livro Actas REFERENCIAS BIBLIOGRÁF
- Page 72 and 73:
Livro Actas EFEITO NAS CARACTERÍST
- Page 74 and 75:
2 - MATERIAIS E MéTODOS Os vinhos
- Page 76 and 77:
Livro Actas Quadro 1 - Resultados o
- Page 78 and 79:
Livro Actas Quadro 3 - Valores méd
- Page 80 and 81:
Livro Actas Comparando os resultado
- Page 82:
REFERÊNCIAS BIBLIOGRÁFICAS Cosme,
- Page 85 and 86:
Livro Actas submetidos a pressões
- Page 87 and 88:
Livro Actas 2.4 - Análise da compo
- Page 89 and 90:
Livro Actas Os vinhos pressurizados
- Page 91 and 92:
Livro Actas de aroma podem estar re
- Page 94 and 95:
A ESTABILIZAÇÃO TARTÁRICA DE VIN
- Page 96 and 97:
2 - MATERIAL E MéTODOS 2.1. Vinhos
- Page 98 and 99:
Livro Actas Da observação das fig
- Page 100 and 101:
Livro Actas 4. CONCLUSõES A aplica
- Page 102 and 103:
Livro Actas A MACROOXIGENAÇâO CON
- Page 104 and 105:
controlada do mosto (Ensaio - E), c
- Page 106 and 107:
Livro Actas Na Tabela 3 apresenta-s
- Page 108 and 109:
Livro Actas Tal como foi referido a
- Page 110:
REFERENCIAS BIBLIOGRÁFICAS 109 Liv
- Page 113 and 114:
Livro Actas bastante generalizada n
- Page 115 and 116:
Livro Actas A partir dos extratos p
- Page 117 and 118:
Livro Actas apresentaram valores de
- Page 119 and 120:
Livro Actas 4 - CONCLUSõES Conside
- Page 122 and 123:
Livro Actas CARACTERÍSTICAS CROMÁ
- Page 124 and 125:
temperatura ambiente. No final, as
- Page 126 and 127:
Livro Actas Na tabela 1 apresentam-
- Page 128 and 129:
Livro Actas Figura 3 - Perfis croma
- Page 130:
129 Livro Actas 4-CONCLUSõES: Este
- Page 133 and 134:
Livro Actas apenas autoriza a utili
- Page 135 and 136:
Livro Actas 2.2.2. Extracção com
- Page 137 and 138:
Livro Actas foi de 280ºC; o perío
- Page 139 and 140:
Livro Actas de compostos como a van
- Page 142 and 143:
Livro Actas CARACTERIZAÇÃO SENSOR
- Page 144 and 145:
2 - MATERIAL E MéTODOS 2.1 - Vinho
- Page 146 and 147:
Livro Actas Os vinhos vinificados e
- Page 148 and 149:
Livro Actas Os vinhos da casta Gouv
- Page 150:
the evolution of aromatic compounds
- Page 153 and 154:
Livro Actas ceso de vinificación y
- Page 155 and 156:
Livro Actas 3.4. Vinificación Las
- Page 157 and 158:
Livro Actas En la Figura 1.a. se ha
- Page 159 and 160:
Livro Actas La presencia de whiskyl
- Page 162 and 163:
Livro Actas DIFERENCIAÇÃO DE VINH
- Page 164 and 165:
Livro Actas detector de fotodíodos
- Page 166 and 167:
Livro Actas Na série das antociani
- Page 168 and 169:
Livro Actas Os vinhos colocados à
- Page 170:
REFERÊNCIAS BIBLIOGRÁFICAS 169 Li
- Page 173 and 174:
Livro Actas cesso de vinificação
- Page 175 and 176:
Livro Actas 3 - RESULTADOS E DISCUS
- Page 177 and 178:
Livro Actas Os resultados obtidos p
- Page 179 and 180:
Livro Actas 5 - AGRADECIMENTOS Este
- Page 181 and 182:
Livro Actas presente em certas etap
- Page 183 and 184:
Livro Actas As amostras foram recol
- Page 185 and 186:
Livro Actas O teor de acetaldeído
- Page 187 and 188:
Livro Actas 3.5 - Efeito do transpo
- Page 189 and 190:
Livro Actas REFERÊNCIAS BIBLIOGRÁ
- Page 192 and 193:
Livro Actas UTILIZAÇÃO DA CARBOXI
- Page 194 and 195:
Assim, o objectivo do presente trab
- Page 196 and 197:
2.8 - Viscosidade A viscosidade foi
- Page 198 and 199:
Livro Actas No que diz respeito ao
- Page 200 and 201:
199 Livro Actas 4 - CONCLUSõES Ap
- Page 202 and 203:
Livro Actas CARACTERIZAÇÃO DOS CO
- Page 204 and 205:
Livro Actas A atividade antioxidant
- Page 206 and 207:
Livro Actas Villano et al., 2006).
- Page 208:
REFERÊNCIAS BIBLIOGRÁFICAS 207 Li
- Page 211 and 212:
Livro Actas não deve significar qu
- Page 213 and 214:
Livro Actas entre o raio do topo e
- Page 215 and 216:
Livro Actas Segundo Boulton (2001)
- Page 217 and 218:
Livro Actas Na análise sensorial d
- Page 220 and 221:
Livro Actas EVALUACIÓN DEL POTENCI
- Page 222 and 223:
2 - MATERIALES Y MéTODOS Extracto
- Page 224 and 225:
Livro Actas en la retención en el
- Page 226 and 227:
Livro Actas observó que en todos l
- Page 228 and 229:
Livro Actas AGRADECIMIENTOS Queremo
- Page 230 and 231:
MICROBIOMA DAS UVAS E FERMENTAÇõE
- Page 232 and 233:
2.2-Extração do ADN, construção
- Page 234 and 235:
233 Livro Actas 3.2-Comunidade Micr
- Page 236 and 237:
235 Livro Actas Lachancea e o Minho
- Page 238:
REFERÊNCIAS BIBLIOGRÁFICAS 237 Li
- Page 241 and 242:
Livro Actas a Hanseniaspora uvarum
- Page 243 and 244:
Livro Actas 2.2-Seleção de primer
- Page 245 and 246:
Livro Actas 3.2-Teste de sensibilid
- Page 247 and 248:
Livro Actas Figura 4: A) Identifica
- Page 250 and 251:
Livro Actas PRODUCCIÓN DE LEVADURA
- Page 252 and 253:
Se sabe que la limitación de oxige
- Page 254 and 255:
Se realizó un seguimiento del crec
- Page 256 and 257:
Livro Actas 3.2 - Rendimiento de lo
- Page 258:
Fleet, G. H. and Heard, G. M. (1993
- Page 261 and 262:
Livro Actas otros productos secunda
- Page 263 and 264:
Livro Actas en el ensayo IS. La pri
- Page 265 and 266:
Livro Actas Cinética fermentativa
- Page 267 and 268:
Livro Actas Los vinos de Chardonnay
- Page 269 and 270:
Livro Actas Tabla 6. Compuestos vol
- Page 271 and 272:
Livro Actas en los vinos IS. Asimis
- Page 273 and 274:
Livro Actas O.I.V. Recueil des mét
- Page 275 and 276:
Livro Actas 1-INTRODUÇÃO Sendo o
- Page 277 and 278:
Livro Actas foi feita por electrofo
- Page 279 and 280:
Livro Actas Com este conjunto de 14
- Page 281 and 282:
Livro Actas 4-CONCLUSõES Neste tra
- Page 284 and 285:
Livro Actas THE EFFECT OF WINE COMP
- Page 286 and 287:
nitrogen broth (6.7 g/L YNB with 10
- Page 288 and 289:
Livro Actas Glucose showed its posi
- Page 290:
affecting the production of 4-ethyl
- Page 293 and 294:
Livro Actas 3 - MAIN TEXT Agrobacte
- Page 295 and 296:
Livro Actas Other important factors
- Page 297 and 298:
Livro Actas 4 -REFERENCES Chen, X.,
- Page 299 and 300:
Livro Actas A videira pode ser colo
- Page 301 and 302:
Livro Actas 3-RESULTADOS E DISCUSS
- Page 303 and 304:
Livro Actas Importa ainda referir q
- Page 305 and 306:
Livro Actas RENOUF V, Claisse O, Lo
- Page 307 and 308:
Livro Actas minadas característica
- Page 309 and 310:
Livro Actas Las bandas con tamaños
- Page 311 and 312:
Livro Actas en tres estados de la f
- Page 313 and 314:
Livro Actas 4.- BIBLIOGRAFIA - Biss
- Page 316 and 317:
BOTRYTIS CINEREA PROTEOME STUDIES F
- Page 318 and 319:
of proteomic techniques has accumul
- Page 320 and 321:
species worldwide. The wide variety
- Page 322 and 323:
two phenotypically different stages
- Page 324 and 325:
CARACTERIZACIÓN DE NUEVAS LEVADURA
- Page 326 and 327:
segunda fermentación (Martinez-Rod
- Page 328 and 329:
EX88, EX98, EX88R, E3AR1, y SMR165A
- Page 330 and 331:
Figura 2. Evolución de la cantidad
- Page 332:
ufacture of cavas (Sparkling wines)
- Page 335 and 336:
Livro Actas en forma seca ha ido ca
- Page 337 and 338:
Livro Actas maloláctica con bacter
- Page 339 and 340:
Livro Actas dos y cuantificables co
- Page 341 and 342:
Livro Actas REFERENCIAS BIBLIOGRÁF
- Page 344 and 345:
A PROTECÇÃO INTEGRADA DA VINHA EM
- Page 346 and 347:
2 - A PROTECÇÃO INTEGRADA DA VINH
- Page 348 and 349:
espeitando as virtudes da democraci
- Page 350 and 351:
sempre presente no PLANO da AFN de
- Page 352 and 353:
ciação dos Consumidores da Regiã
- Page 354 and 355:
● “a formação em protecção
- Page 356 and 357:
exigência do tabu (5 p. 106-108),
- Page 358 and 359: guém”. “Há 3 anos que sistema
- Page 360 and 361: da saúde pública e do ambiente ou
- Page 362 and 363: REFERÊNCIAS BIBLIOGRÁFICAS 1 - AJ
- Page 364 and 365: A EVOLUÇÃO DOS PESTICIDAS E DA Á
- Page 366 and 367: Em Portugal, tem predominado o cons
- Page 368 and 369: 2.2 - Os pesticidas homologados, au
- Page 370 and 371: gadas variam entre 12 (cigarrinha-v
- Page 372 and 373: Dezembro de 2012, a lista dos 8 Org
- Page 374: REFERÊNCIAS BIBLIOGRÁFICCAS 1 - A
- Page 377 and 378: Livro Actas dade (6 p. 27) . Na Dir
- Page 379 and 380: Livro Actas a BPF tem só 2 objecti
- Page 381 and 382: Livro Actas 3.3 - O Plano da Autori
- Page 383 and 384: Livro Actas • art.16º.1d, deturp
- Page 385 and 386: Livro Actas 6- REFERÊNCIAS BIBLIOG
- Page 387 and 388: Livro Actas to carry out plowing be
- Page 389 and 390: Livro Actas mm in 2009, 2010, 2011
- Page 391 and 392: Livro Actas D. Prieto Picudo. No st
- Page 393 and 394: Livro Actas D. Prieto Picudo. The a
- Page 396 and 397: EFECTOS DEL USO DE UNA CUBIERTA VEG
- Page 398 and 399: llevado a cabo mediante desbrozado
- Page 400 and 401: TABLAS Y FIGURAS 399 Livro Actas
- Page 402 and 403: 401 Livro Actas
- Page 404: AGRADECIMIENTOS Los resultados pres
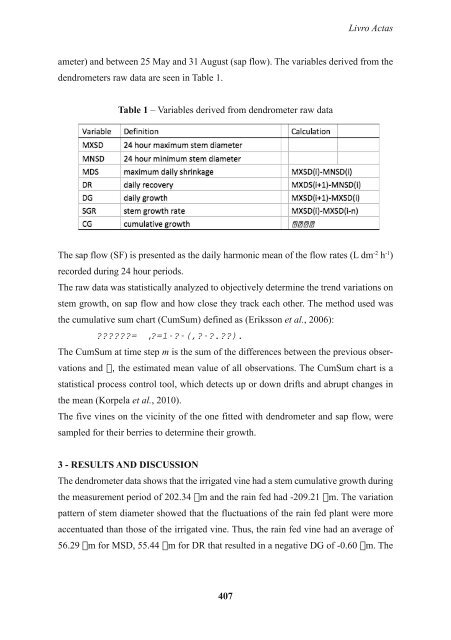
- Page 407: Livro Actas growth are indicative o
- Page 411 and 412: Livro Actas conductance (Buckley, 2
- Page 413: Livro Actas rics AB, Sweeden. Escal