

The Performance of Seaport Clusters - RePub - Erasmus Universiteit ...
The Performance of Seaport Clusters - RePub - Erasmus Universiteit ...
The Performance of Seaport Clusters - RePub - Erasmus Universiteit ...

Create successful ePaper yourself
Turn your PDF publications into a flip-book with our unique Google optimized e-Paper software.
Chapter 12 – Analyzing Strenghts and Weaknesses <strong>of</strong> <strong>Seaport</strong> <strong>Clusters</strong> 187<br />
compared to Houston. Third, the diversity <strong>of</strong> the cluster is limited, and fourth, the presence<br />
<strong>of</strong> intermediaries is limited. Fifth, the LMPC is a ‘low trust cluster’ compared to Houston. <strong>The</strong><br />
only strength <strong>of</strong> the LMPC compared to Houston is the low level <strong>of</strong> congestion.<br />
<strong>The</strong>se strengths and weaknesses indicate that the LMPC is a weak cluster. Agglomeration<br />
economies are absent; the main strength <strong>of</strong> the cluster is absence <strong>of</strong> congestion. <strong>The</strong>se are<br />
not ‘advanced strengths’. <strong>The</strong> following performance indicators are available to compare the<br />
LMPC with other Gulf ports (see Table 83, Table 84, and Table 85).<br />
Table 83: Market shares <strong>of</strong> the LMPC and three other gulf ports in the total US port throughput.<br />
Market shares 1990 1997 2000 2001<br />
LMPC 18.0% 18.1% 17.6% 17.2%<br />
Houston 5.8% 7.1% 7.8% 7.6%<br />
Mobile 1.9% 2.1% 2.2% 2.0%<br />
Tampa 2.4% 2.4% 2.2% 1.9%<br />
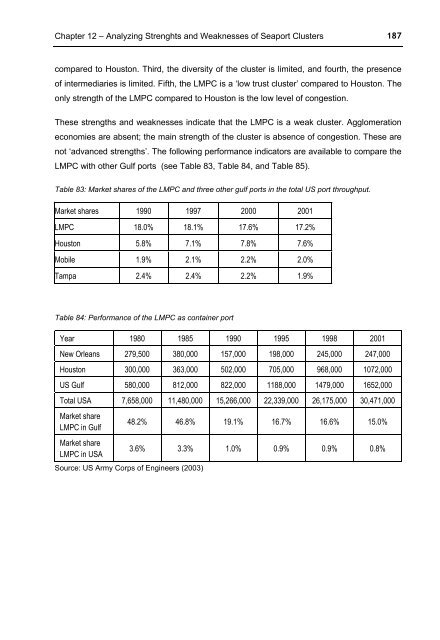
Table 84: <strong>Performance</strong> <strong>of</strong> the LMPC as container port<br />
Year 1980 1985 1990 1995 1998 2001<br />
New Orleans 279,500 380,000 157,000 198,000 245,000 247,000<br />
Houston 300,000 363,000 502,000 705,000 968,000 1072,000<br />
US Gulf 580,000 812,000 822,000 1188,000 1479,000 1652,000<br />
Total USA 7,658,000 11,480,000 15,266,000 22,339,000 26,175,000 30,471,000<br />
Market share<br />
LMPC in Gulf<br />
Market share<br />
LMPC in USA<br />
48.2% 46.8% 19.1% 16.7% 16.6% 15.0%<br />
Source: US Army Corps <strong>of</strong> Engineers (2003)<br />
3.6% 3.3% 1.0% 0.9% 0.9% 0.8%


