Proceedings of the 12th European Conference on Knowledge ...
Proceedings of the 12th European Conference on Knowledge ...
Proceedings of the 12th European Conference on Knowledge ...

Create successful ePaper yourself
Turn your PDF publications into a flip-book with our unique Google optimized e-Paper software.
Juan-Gabriel Cegarra-Navarro, Mª Eugenia Sánchez-Vidal and David Cegarra-Leiva<br />
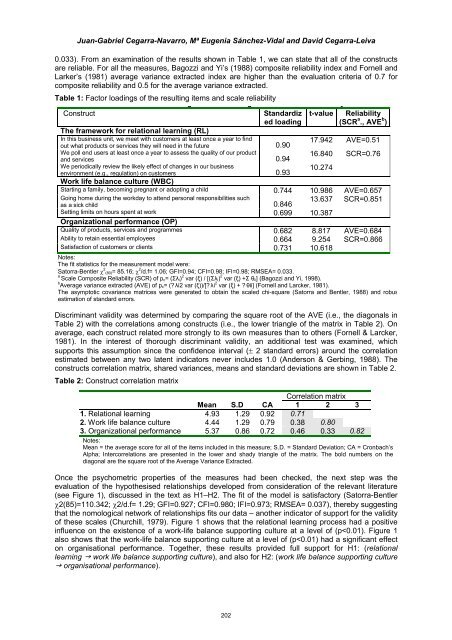
0.033). From an examinati<strong>on</strong> <str<strong>on</strong>g>of</str<strong>on</strong>g> <str<strong>on</strong>g>the</str<strong>on</strong>g> results shown in Table 1, we can state that all <str<strong>on</strong>g>of</str<strong>on</strong>g> <str<strong>on</strong>g>the</str<strong>on</strong>g> c<strong>on</strong>structs<br />
are reliable. For all <str<strong>on</strong>g>the</str<strong>on</strong>g> measures, Bagozzi and Yi’s (1988) composite reliability index and Fornell and<br />
Larker’s (1981) average variance extracted index are higher than <str<strong>on</strong>g>the</str<strong>on</strong>g> evaluati<strong>on</strong> criteria <str<strong>on</strong>g>of</str<strong>on</strong>g> 0.7 for<br />
composite reliability and 0.5 for <str<strong>on</strong>g>the</str<strong>on</strong>g> average variance extracted.<br />
Table 1: Factor loadings <str<strong>on</strong>g>of</str<strong>on</strong>g> <str<strong>on</strong>g>the</str<strong>on</strong>g> resulting items and scale reliability<br />
g g y<br />
C<strong>on</strong>struct Standardiz<br />
ed loading<br />
t-value Reliability<br />
(SCR a ., AVE b The framework for relati<strong>on</strong>al learning (RL)<br />
)<br />
In this business unit, we meet with customers at least <strong>on</strong>ce a year to find<br />
out what products or services <str<strong>on</strong>g>the</str<strong>on</strong>g>y will need in <str<strong>on</strong>g>the</str<strong>on</strong>g> future 0.90<br />
17.942 AVE=0.51<br />
We poll end users at least <strong>on</strong>ce a year to assess <str<strong>on</strong>g>the</str<strong>on</strong>g> quality <str<strong>on</strong>g>of</str<strong>on</strong>g> our product<br />
and services 0.94<br />
16.840 SCR=0.76<br />
We periodically review <str<strong>on</strong>g>the</str<strong>on</strong>g> likely effect <str<strong>on</strong>g>of</str<strong>on</strong>g> changes in our business<br />
envir<strong>on</strong>ment (e.g., regulati<strong>on</strong>) <strong>on</strong> customers<br />
Work life balance culture (WBC)<br />
0.93<br />
10.274<br />
Starting a family, becoming pregnant or adopting a child 0.744 10.986 AVE=0.657<br />
Going home during <str<strong>on</strong>g>the</str<strong>on</strong>g> workday to attend pers<strong>on</strong>al resp<strong>on</strong>sibilities such<br />
as a sick child 0.846<br />
13.637 SCR=0.851<br />
Setting limits <strong>on</strong> hours spent at work<br />
Organizati<strong>on</strong>al performance (OP)<br />
0.699 10.387<br />
Quality <str<strong>on</strong>g>of</str<strong>on</strong>g> products, services and programmes 0.682 8.817 AVE=0.684<br />
Ability to retain essential employees 0.664 9.254 SCR=0.866<br />
Satisfacti<strong>on</strong> <str<strong>on</strong>g>of</str<strong>on</strong>g> customers or clients<br />
Notes:<br />
The fit statistics for <str<strong>on</strong>g>the</str<strong>on</strong>g> measurement model were:<br />
0.731 10.618<br />
Satorra-Bentler χ 2 (80)= 85.16; χ 2 /d.f= 1.06; GFI=0.94; CFI=0.98; IFI=0.98; RMSEA= 0.033.<br />
a 2 2<br />
Scale Composite Reliability (SCR) <str<strong>on</strong>g>of</str<strong>on</strong>g> pc= (Σλi) var (ξ) / [(Σλi) var (ξ) +Σ θii] (Bagozzi and Yi, 1998).<br />
b 2<br />
Average variance extracted (AVE) <str<strong>on</strong>g>of</str<strong>on</strong>g> pc= (? λi2 var (ξ))/[? λi var (ξ) + ? θii] (Fornell and Larcker, 1981).<br />
The asymptotic covariance matrices were generated to obtain <str<strong>on</strong>g>the</str<strong>on</strong>g> scaled chi-square (Satorra and Bentler, 1988) and robus<br />
estimati<strong>on</strong> <str<strong>on</strong>g>of</str<strong>on</strong>g> standard errors.<br />
Discriminant validity was determined by comparing <str<strong>on</strong>g>the</str<strong>on</strong>g> square root <str<strong>on</strong>g>of</str<strong>on</strong>g> <str<strong>on</strong>g>the</str<strong>on</strong>g> AVE (i.e., <str<strong>on</strong>g>the</str<strong>on</strong>g> diag<strong>on</strong>als in<br />
Table 2) with <str<strong>on</strong>g>the</str<strong>on</strong>g> correlati<strong>on</strong>s am<strong>on</strong>g c<strong>on</strong>structs (i.e., <str<strong>on</strong>g>the</str<strong>on</strong>g> lower triangle <str<strong>on</strong>g>of</str<strong>on</strong>g> <str<strong>on</strong>g>the</str<strong>on</strong>g> matrix in Table 2). On<br />
average, each c<strong>on</strong>struct related more str<strong>on</strong>gly to its own measures than to o<str<strong>on</strong>g>the</str<strong>on</strong>g>rs (Fornell & Larcker,<br />
1981). In <str<strong>on</strong>g>the</str<strong>on</strong>g> interest <str<strong>on</strong>g>of</str<strong>on</strong>g> thorough discriminant validity, an additi<strong>on</strong>al test was examined, which<br />
supports this assumpti<strong>on</strong> since <str<strong>on</strong>g>the</str<strong>on</strong>g> c<strong>on</strong>fidence interval (± 2 standard errors) around <str<strong>on</strong>g>the</str<strong>on</strong>g> correlati<strong>on</strong><br />
estimated between any two latent indicators never includes 1.0 (Anders<strong>on</strong> & Gerbing, 1988). The<br />
c<strong>on</strong>structs correlati<strong>on</strong> matrix, shared variances, means and standard deviati<strong>on</strong>s are shown in Table 2.<br />
Table 2: C<strong>on</strong>struct correlati<strong>on</strong> matrix<br />
Correlati<strong>on</strong> matrix<br />
Mean S.D CA 1 2 3<br />
1. Relati<strong>on</strong>al learning 4.93 1.29 0.92 0.71<br />
2. Work life balance culture 4.44 1.29 0.79 0.38 0.80<br />
3. Organizati<strong>on</strong>al performance<br />
Notes:<br />
5.37 0.86 0.72 0.46 0.33 0.82<br />
Mean = <str<strong>on</strong>g>the</str<strong>on</strong>g> average score for all <str<strong>on</strong>g>of</str<strong>on</strong>g> <str<strong>on</strong>g>the</str<strong>on</strong>g> items included in this measure; S.D. = Standard Deviati<strong>on</strong>; CA = Cr<strong>on</strong>bach’s<br />
Alpha; Intercorrelati<strong>on</strong>s are presented in <str<strong>on</strong>g>the</str<strong>on</strong>g> lower and shady triangle <str<strong>on</strong>g>of</str<strong>on</strong>g> <str<strong>on</strong>g>the</str<strong>on</strong>g> matrix. The bold numbers <strong>on</strong> <str<strong>on</strong>g>the</str<strong>on</strong>g><br />
diag<strong>on</strong>al are <str<strong>on</strong>g>the</str<strong>on</strong>g> square root <str<strong>on</strong>g>of</str<strong>on</strong>g> <str<strong>on</strong>g>the</str<strong>on</strong>g> Average Variance Extracted.<br />
Once <str<strong>on</strong>g>the</str<strong>on</strong>g> psychometric properties <str<strong>on</strong>g>of</str<strong>on</strong>g> <str<strong>on</strong>g>the</str<strong>on</strong>g> measures had been checked, <str<strong>on</strong>g>the</str<strong>on</strong>g> next step was <str<strong>on</strong>g>the</str<strong>on</strong>g><br />
evaluati<strong>on</strong> <str<strong>on</strong>g>of</str<strong>on</strong>g> <str<strong>on</strong>g>the</str<strong>on</strong>g> hypo<str<strong>on</strong>g>the</str<strong>on</strong>g>sised relati<strong>on</strong>ships developed from c<strong>on</strong>siderati<strong>on</strong> <str<strong>on</strong>g>of</str<strong>on</strong>g> <str<strong>on</strong>g>the</str<strong>on</strong>g> relevant literature<br />
(see Figure 1), discussed in <str<strong>on</strong>g>the</str<strong>on</strong>g> text as H1–H2. The fit <str<strong>on</strong>g>of</str<strong>on</strong>g> <str<strong>on</strong>g>the</str<strong>on</strong>g> model is satisfactory (Satorra-Bentler<br />
χ2(85)=110.342; χ2/d.f= 1.29; GFI=0.927; CFI=0.980; IFI=0.973; RMSEA= 0.037), <str<strong>on</strong>g>the</str<strong>on</strong>g>reby suggesting<br />
that <str<strong>on</strong>g>the</str<strong>on</strong>g> nomological network <str<strong>on</strong>g>of</str<strong>on</strong>g> relati<strong>on</strong>ships fits our data – ano<str<strong>on</strong>g>the</str<strong>on</strong>g>r indicator <str<strong>on</strong>g>of</str<strong>on</strong>g> support for <str<strong>on</strong>g>the</str<strong>on</strong>g> validity<br />
<str<strong>on</strong>g>of</str<strong>on</strong>g> <str<strong>on</strong>g>the</str<strong>on</strong>g>se scales (Churchill, 1979). Figure 1 shows that <str<strong>on</strong>g>the</str<strong>on</strong>g> relati<strong>on</strong>al learning process had a positive<br />
influence <strong>on</strong> <str<strong>on</strong>g>the</str<strong>on</strong>g> existence <str<strong>on</strong>g>of</str<strong>on</strong>g> a work-life balance supporting culture at a level <str<strong>on</strong>g>of</str<strong>on</strong>g> (p