- Page 1 and 2:
Proceedings <stron
- Page 3 and 4:
Contents Title Author(s) Picture <s
- Page 5 and 6:
Title Author(s) Picture of<
- Page 7 and 8:
Volume Two The Influence of
- Page 9 and 10:
The Symbolic Innovation of<
- Page 11 and 12:
Biographies of <st
- Page 13 and 14:
Jan Pawlowski works as Prof
- Page 15 and 16:
in academia. He holds the</
- Page 17 and 18:
Biomedical Engineering Research Cen
- Page 19 and 20:
Mathematics and Ph
- Page 21 and 22:
Thi Hai Hang Nguyen is a lecturer a
- Page 23 and 24:
Dan Savescu graduate TCM Faculty, p
- Page 25:
Teaches Business Computing and Stat
- Page 28 and 29:
Abdallah Al-Shawabkeh, Alexander K<
- Page 30 and 31:
Abdallah Al-Shawabkeh, Alexander K<
- Page 32 and 33:
Abdallah Al-Shawabkeh, Alexander K<
- Page 34 and 35:
Table 1: Inn-KM approach contents 2
- Page 36 and 37:
Knowledge Dynamics and Organisation
- Page 38 and 39:
Eckhard Ammann We distinguish three
- Page 40 and 41:
Eckhard Ammann quality dimension ar
- Page 42 and 43:
Eckhard Ammann The second cycle, Cy
- Page 44 and 45:
Figure 7: Supervised learning-by-do
- Page 46 and 47:
Identifying and Ranking the
- Page 48 and 49:
Manouchehr Ansari et al users <stro
- Page 50 and 51:
2.5 leadership and strategy Manouch
- Page 52 and 53:
Manouchehr Ansari et al conducted s
- Page 54 and 55:
Serious Games in the</stron
- Page 56 and 57:
Albena Antonova and Anandasivakumar
- Page 58 and 59:
Albena Antonova and Anandasivakumar
- Page 60 and 61:
Albena Antonova and Anandasivakumar
- Page 62 and 63:
Albena Antonova and Anandasivakumar
- Page 64 and 65:
Albena Antonova and Aniko Csepregi
- Page 66 and 67:
Albena Antonova and Aniko Csepregi
- Page 68 and 69:
Albena Antonova and Aniko Csepregi
- Page 70 and 71:
Albena Antonova and Aniko Csepregi
- Page 72 and 73:
Seyed Esmaeil Asgharpour and Gholam
- Page 74 and 75:
Attitude of Senior
- Page 76 and 77:
Seyed Esmaeil Asgharpour and Gholam
- Page 78 and 79:
4.5 Comparative Advantage Seyed Esm
- Page 80 and 81:
Seyed Esmaeil Asgharpour and Gholam
- Page 82 and 83:
Contextual Adaptive Visualization E
- Page 84 and 85:
Xiaoyan Bai, David White and David
- Page 86 and 87:
Xiaoyan Bai, David White and David
- Page 88 and 89:
Xiaoyan Bai, David White and David
- Page 90 and 91:
Xiaoyan Bai, David White and David
- Page 92 and 93:
Simona-Clara Bârsan, Mihaela-Georg
- Page 94 and 95:
2.4 Rights transfer Simona-Clara B
- Page 96 and 97:
Simona-Clara Bârsan, Mihaela-Georg
- Page 98 and 99:
Simona-Clara Bârsan, Mihaela-Georg
- Page 100 and 101:
A Framework for the</strong
- Page 102 and 103:
Leila Beig et al Additionally, Wei
- Page 104 and 105:
Leila Beig et al The proposed KM au
- Page 106 and 107:
Leila Beig et al source context Ele
- Page 108 and 109:
Leila Beig et al Figure 1: Learning
- Page 110 and 111:
Leila Beig et al Figure 3 visually
- Page 112 and 113:
Leila Beig et al based on collectiv
- Page 114 and 115:
Experiential Knowledge Creation Pro
- Page 116 and 117:
Didiosky Benítez et al Figure 1: E
- Page 118 and 119:
Didiosky Benítez et al meanings ac
- Page 120 and 121:
Didiosky Benítez et al In previous
- Page 122 and 123:
Didiosky Benítez et al Academic p
- Page 124 and 125:
Pavel Bogolyubov Figure 1: number <
- Page 126 and 127:
4. Results and discussion Pavel Bog
- Page 128 and 129:
Pavel Bogolyubov Knowledge Manageme
- Page 130 and 131:
Pavel Bogolyubov Table 3: Countries
- Page 132 and 133:
Pavel Bogolyubov McNamee, R. C., N.
- Page 134 and 135:
Ettore Bolisani, Francesca Gambarot
- Page 136 and 137:
Ettore Bolisani, Francesca Gambarot
- Page 138 and 139:
Ettore Bolisani, Francesca Gambarot
- Page 140 and 141:
Table 2: Synthesis
- Page 142 and 143:
Ettore Bolisani, Marco Paiola and E
- Page 144 and 145:
Ettore Bolisani, Marco Paiola and E
- Page 146 and 147:
Ettore Bolisani, Marco Paiola and E
- Page 148 and 149:
Ettore Bolisani, Marco Paiola and E
- Page 150 and 151:
Strategies for Increasing Knowledge
- Page 152 and 153:
Constantin Bratianu, Adriana Agapie
- Page 154 and 155:
Constantin Bratianu, Adriana Agapie
- Page 156 and 157:
Constantin Bratianu, Adriana Agapie
- Page 158 and 159:
Klaus Bredl, Amrei Groß and Jane F
- Page 160 and 161:
Klaus Bredl, Amrei Groß and Jane F
- Page 162 and 163:
Klaus Bredl, Amrei Groß and Jane F
- Page 164 and 165:
Klaus Bredl, Amrei Groß and Jane F
- Page 166 and 167:
Camelia Burja and Vasile Burja Appr
- Page 168 and 169:
∀ , i ≥ 0 v u i where: ui repre
- Page 170 and 171:
Camelia Burja and Vasile Burja Tabl
- Page 172 and 173:
Camelia Burja and Vasile Burja info
- Page 174 and 175:
Camelia Burja and Vasile Burja Jack
- Page 176 and 177:
Adriana Schiopoiu Burlea With respe
- Page 178 and 179:
Adriana Schiopoiu Burlea 3. ESF rol
- Page 180 and 181:
Adriana Schiopoiu Burlea In <strong
- Page 182 and 183:
3.2 Discussions Adriana Schiopoiu B
- Page 184 and 185:
Adriana Schiopoiu Burlea Nonaka, I.
- Page 186 and 187:
Simon Cadez and Vlado Dimovski with
- Page 188 and 189:
Simon Cadez and Vlado Dimovski scho
- Page 190 and 191:
Simon Cadez and Vlado Dimovski It i
- Page 192 and 193:
Why Should I Share my new ideas? Cu
- Page 194 and 195:
Francesco Calza, Rossella Canestrin
- Page 196 and 197:
Francesco Calza, Rossella Canestrin
- Page 198 and 199:
Francesco Calza, Rossella Canestrin
- Page 200 and 201:
Francesco Calza, Rossella Canestrin
- Page 202 and 203:
José Manuel Cardenas and Mauro Spi
- Page 204 and 205:
José Manuel Cardenas and Mauro Spi
- Page 206 and 207:
José Manuel Cardenas and Mauro Spi
- Page 208 and 209:
Vincenzo Cavaliere and Daria Sarti
- Page 210 and 211:
Vincenzo Cavaliere and Daria Sarti
- Page 212 and 213:
Vincenzo Cavaliere and Daria Sarti
- Page 214 and 215:
Vincenzo Cavaliere and Daria Sarti
- Page 216 and 217:
National Knowledge Management Strat
- Page 218 and 219:
Behiye Çavuşoğlu and Mustafa Sag
- Page 220 and 221:
Behiye Çavuşoğlu and Mustafa Sag
- Page 222 and 223:
Behiye Çavuşoğlu and Mustafa Sag
- Page 224 and 225:
Implementing a work-life balance cu
- Page 226 and 227:
Juan-Gabriel Cegarra-Navarro, Mª E
- Page 228 and 229:
Juan-Gabriel Cegarra-Navarro, Mª E
- Page 230 and 231:
Juan-Gabriel Cegarra-Navarro, Mª E
- Page 232 and 233:
The Influence of R
- Page 234 and 235:
Huei-Fang Chen and Yi-Wen Lin outco
- Page 236 and 237:
3.2.4 Knowledge-sharing Huei-Fang C
- Page 238 and 239:
Huei-Fang Chen and Yi-Wen Lin that
- Page 240 and 241:
Huei-Fang Chen and Yi-Wen Lin Hair,
- Page 242 and 243:
2.1.2 Social capital Marguerite Cro
- Page 244 and 245:
Marguerite Cronk 2.3 Social capital
- Page 246 and 247:
Marguerite Cronk Figure 4: The rela
- Page 248 and 249:
An Exploratory Study of</st
- Page 250 and 251:
Françoise de Viron, Thomas Lederer
- Page 252 and 253:
4.1.2 The researchers Françoise de
- Page 254 and 255:
Françoise de Viron, Thomas Lederer
- Page 256 and 257:
Françoise de Viron, Thomas Lederer
- Page 258 and 259:
The Application of
- Page 260 and 261:
Nasser Easa and Robin Fincham 3. Th
- Page 262 and 263:
Nasser Easa and Robin Fincham knowl
- Page 264 and 265:
Nasser Easa and Robin Fincham <stro
- Page 266 and 267:
Network Management as a way to Mana
- Page 268 and 269:
Eva Eckenhofer An
- Page 270 and 271:
Eva Eckenhofer par
- Page 272 and 273:
Initiation Configuration Interessem
- Page 274 and 275:
Eva Eckenhofer Eve
- Page 276 and 277:
The Essence of Kno
- Page 278 and 279:
Emmanuel Innocents Edoun and Valden
- Page 280 and 281:
4. Case study and analysis Emmanuel
- Page 282 and 283:
Emmanuel Innocents Edoun and Valden
- Page 284 and 285: Emmanuel Innocents Edoun and Valden
- Page 286 and 287: 2. The PUS-project Anandasivakumar
- Page 288 and 289: Anandasivakumar Ekambaram and Agnar
- Page 290 and 291: Anandasivakumar Ekambaram and Agnar
- Page 292 and 293: Anandasivakumar Ekambaram and Agnar
- Page 294 and 295: Jamal El-Den and Xin Zhou This rese
- Page 296 and 297: Jamal El-Den and Xin Zhou 5. After
- Page 298 and 299: Jamal El-Den and Xin Zhou includes
- Page 300 and 301: Jamal El-Den and Xin Zhou Boyce, C.
- Page 302 and 303: Tiit Elenurm development visions. C
- Page 304 and 305: Tiit Elenurm companies the<
- Page 306 and 307: Tiit Elenurm their
- Page 308 and 309: References Tiit Elenurm Accorsi, F.
- Page 310 and 311: Isaac Enakimio and Abdallah Al-Shaw
- Page 312 and 313: Isaac Enakimio and Abdallah Al-Shaw
- Page 314 and 315: Isaac Enakimio and Abdallah Al-Shaw
- Page 316 and 317: A proposed Framework for Discoverin
- Page 318 and 319: 2.3 Knowledge mapping Mohamad Ali F
- Page 320 and 321: Mohamad Ali Feyz, Babak Akhgar and
- Page 322 and 323: Mohamad Ali Feyz, Babak Akhgar and
- Page 324 and 325: Knowledge Workers: A Typology Frame
- Page 326 and 327: Jiří Franek and Eva Grublova crea
- Page 328 and 329: Jiří Franek and Eva Grublova Know
- Page 330 and 331: Jiří Franek and Eva Grublova memb
- Page 332 and 333: Middle Managers’ Maturity <strong
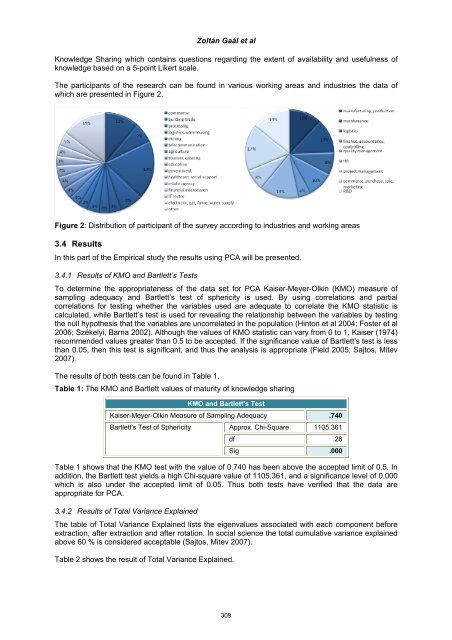
- Page 336 and 337: Zoltán Gaál et al Table 2: Total
- Page 338 and 339: Zoltán Gaál et al characterised b
- Page 340 and 341: Zoltán Gaál et al Matzler, K., Re
- Page 342 and 343: Charles Gagné et al This paper pre
- Page 344 and 345: Charles Gagné et al attributable t
- Page 346 and 347: Charles Gagné et al intermediary d
- Page 348 and 349: Adoption of Knowle
- Page 350 and 351: 1.1.2 SMEs and KMS Tendayi Gondo an
- Page 352 and 353: Tendayi Gondo and Edmore Kori ambit
- Page 354 and 355: Tendayi Gondo and Edmore Kori <stro
- Page 356 and 357: Tendayi Gondo and Edmore Kori demon
- Page 358 and 359: The Chain Value Process and Knowled
- Page 360 and 361: Manel González-Piñero et al Captu
- Page 362 and 363: 4. What a biofeedb
- Page 364 and 365: Manel González-Piñero et al The p
- Page 366 and 367: References Manel González-Piñero
- Page 368 and 369: Nebojsa Graca and Ana Lucija Gojako
- Page 370 and 371: Nebojsa Graca and Ana Lucija Gojako
- Page 372 and 373: Nebojsa Graca and Ana Lucija Gojako
- Page 374 and 375: creating new, added, essential qual
- Page 376 and 377: Norbert Gronau et al Those processe
- Page 378 and 379: Norbert Gronau et al systematic mod
- Page 380 and 381: Instance Schema Figure 4: Cyclic tr
- Page 382 and 383: Norbert Gronau et al 4.2 Feasibilit
- Page 384 and 385:
Receive suggestions Compare suggest
- Page 386 and 387:
The Not-Invented-Here Syndrome in A
- Page 388 and 389:
David Grosse Kathoefer and Jens Lek
- Page 390 and 391:
David Grosse Kathoefer and Jens Lek
- Page 392 and 393:
Opinion of colleag
- Page 394 and 395:
David Grosse Kathoefer and Jens Lek
- Page 396 and 397:
Appendix David Grosse Kathoefer and
- Page 398 and 399:
Individual Level Influencers on Tac
- Page 400 and 401:
Claire Gubbins et al that such know
- Page 402 and 403:
Claire Gubbins et al 3.2 Individual
- Page 404 and 405:
Claire Gubbins et al “my thing wi
- Page 406 and 407:
Claire Gubbins et al Cabrera, A., C
- Page 408 and 409:
Oscar Guerra and Janeth Rojas Accor
- Page 410 and 411:
Oscar Guerra and Janeth Rojas Figur
- Page 412 and 413:
Why does knowledge transfer process
- Page 414 and 415:
3.7 Monitoring and control Oscar Gu
- Page 416 and 417:
Understanding Personal Knowledge De
- Page 418 and 419:
Markus Haag and Yanqing Duan In ord
- Page 420 and 421:
Markus Haag and Yanqing Duan 4.2 In
- Page 422 and 423:
Markus Haag and Yanqing Duan have a
- Page 424 and 425:
Chaordic Knowledge Management - Shi
- Page 426 and 427:
Frank Habermann, Jörg Fehlinger an
- Page 428 and 429:
Frank Habermann, Jörg Fehlinger an
- Page 430 and 431:
Frank Habermann, Jörg Fehlinger an
- Page 432 and 433:
Frank Habermann, Jörg Fehlinger an
- Page 434 and 435:
Intellectual Capital in Universitie
- Page 436 and 437:
Meliha Handzic and Kursad Ozlen rep
- Page 438 and 439:
Table 3: Opinions about Human Capit
- Page 440 and 441:
Meliha Handzic and Kursad Ozlen How
- Page 442 and 443:
Developing a Knowledge Strategy Usi
- Page 444 and 445:
Harold Harlow knowledge to create c
- Page 446 and 447:
3.1 TKI Regression results Harold H
- Page 448 and 449:
Harold Harlow of <
- Page 450 and 451:
Understanding the
- Page 452 and 453:
3.1 Acquire Ciara Heavin and Freder
- Page 454 and 455:
Table 3: Distribution of</s
- Page 456 and 457:
Ciara Heavin and Frederic Adam Trav
- Page 458 and 459:
Ciara Heavin and Frederic Adam Tabl
- Page 460 and 461:
Ciara Heavin and Frederic Adam prov
- Page 462 and 463:
Key Knowledge Sharing Points: Explo
- Page 464 and 465:
Tore Hoel and Jan Pawlowski identif
- Page 466 and 467:
Tore Hoel and Jan Pawlowski The arc
- Page 468 and 469:
4.2.1 Discussion - Case 2 Tore Hoel
- Page 470 and 471:
Using Web 2.0 Technologies to Suppo
- Page 472 and 473:
Marta Infante Abreu, Florian Mat<st
- Page 474 and 475:
Marta Infante Abreu, Florian Mat<st
- Page 476 and 477:
Marta Infante Abreu, Florian Mat<st
- Page 478 and 479:
Marta Infante Abreu, Florian Mat<st
- Page 480 and 481:
Pamela Chidiogo Izunwanne 2. Knowle
- Page 482 and 483:
Pamela Chidiogo Izunwanne use <stro
- Page 484 and 485:
Pamela Chidiogo Izunwanne 5.3 Organ
- Page 486 and 487:
Pamela Chidiogo Izunwanne Davenport
- Page 488 and 489:
Thomas Janke room for communication
- Page 490 and 491:
Thomas Janke 4. Reference implement
- Page 492 and 493:
Thomas Janke The rule states that w
- Page 494 and 495:
Thomas Janke Softw
- Page 496 and 497:
Towards a Detailed View on
- Page 498 and 499:
Vincent de Jong and Remko Helms Fig
- Page 500 and 501:
4.1 Case study setup Vincent de Jon
- Page 502 and 503:
Vincent de Jong and Remko Helms The
- Page 504 and 505:
Vincent de Jong and Remko Helms mak
- Page 506 and 507:
Vincent de Jong and Remko Helms Man
- Page 508 and 509:
Claudia Jooß et al at RWTH Aachen
- Page 510 and 511:
Claudia Jooß et al Regarding <stro
- Page 512 and 513:
Claudia Jooß et al learning (cf. B
- Page 514 and 515:
Expert Knowledge: Does it Help or H
- Page 516 and 517:
Selvi Kannan are people who have ex
- Page 518 and 519:
Selvi Kannan Amabile (1983) states
- Page 520 and 521:
Selvi Kannan American Task Force, R
- Page 522 and 523:
Integration of Kno
- Page 524 and 525:
Eva-Maria Kern et al Figure 1: Rela
- Page 526 and 527:
Eva-Maria Kern et al identification
- Page 528 and 529:
Eva-Maria Kern et al be gat
- Page 530 and 531:
Eva-Maria Kern et al For visualizin
- Page 532 and 533:
Knowledge Management Practices (KMP
- Page 534 and 535:
Radwan Kharabsheh, Ihab Magableh an
- Page 536 and 537:
Radwan Kharabsheh, Ihab Magableh an
- Page 538 and 539:
Radwan Kharabsheh, Ihab Magableh an
- Page 540 and 541:
Knowledge Management Across <strong
- Page 542 and 543:
Aino Kianto, Tatiana Andreeva and X
- Page 544 and 545:
Aino Kianto, Tatiana Andreeva and X
- Page 546 and 547:
Aino Kianto, Tatiana Andreeva and X
- Page 548 and 549:
5. Conclusions Aino Kianto, Tatiana
- Page 550 and 551:
Facilitating Knowledge Sharing in V
- Page 552 and 553:
Andrea Kő, Péter Fehér and Krisz
- Page 554 and 555:
Andrea Kő, Péter Fehér and Krisz
- Page 556 and 557:
Andrea Kő, Péter Fehér and Krisz
- Page 558 and 559:
Andrea Kő, Péter Fehér and Krisz
- Page 560 and 561:
Andrea Kő, Péter Fehér and Krisz
- Page 562 and 563:
Esther Lage et al
- Page 564 and 565:
Esther Lage et al
- Page 566 and 567:
Esther Lage et al
- Page 568 and 569:
Esther Lage et al
- Page 570 and 571:
Monique Lortie and Lise Desmarais e
- Page 572 and 573:
Monique Lortie and Lise Desmarais 3
- Page 574 and 575:
Monique Lortie and Lise Desmarais I
- Page 576 and 577:
Monique Lortie and Lise Desmarais D
- Page 578 and 579:
Halimah Abdul Manaf, Steven Armstro
- Page 580 and 581:
Halimah Abdul Manaf, Steven Armstro
- Page 582 and 583:
Halimah Abdul Manaf, Steven Armstro
- Page 584 and 585:
Halimah Abdul Manaf, Steven Armstro
- Page 586 and 587:
Halimah Abdul Manaf, Steven Armstro
- Page 588 and 589:
Halimah Abdul Manaf, Steven Armstro
- Page 590 and 591:
Anca Mândruleanu teams, networks a
- Page 592 and 593:
Anca Mândruleanu organization and
- Page 594 and 595:
Anca Mândruleanu Griffin, R.W., Mo
- Page 596 and 597:
Simone Manfredi, Domenico Celenza a
- Page 598 and 599:
Simone Manfredi, Domenico Celenza a
- Page 600 and 601:
Simone Manfredi, Domenico Celenza a
- Page 602 and 603:
Simone Manfredi, Domenico Celenza a
- Page 604 and 605:
Modelling Knowledge Sharing Into a
- Page 606 and 607:
2 masseurs ; Virginia Maracine et a
- Page 608 and 609:
2.1.1 SNA - the co
- Page 610 and 611:
Virginia Maracine et al mapping <st
- Page 612 and 613:
Virginia Maracine et al Which are
- Page 614 and 615:
Objective 1 - Mapping of</s
- Page 616 and 617:
From Knowledge Acquisition to Knowl
- Page 618 and 619:
Peter Marshall and Damian Gordon el
- Page 620 and 621:
Peter Marshall and Damian Gordon kn
- Page 622 and 623:
2.3.4 Types of Kno
- Page 624:
Peter Marshall and Damian Gordon Ma


