

Our performance in 2009 - Sappi
Our performance in 2009 - Sappi
Our performance in 2009 - Sappi

Create successful ePaper yourself
Turn your PDF publications into a flip-book with our unique Google optimized e-Paper software.
100<br />
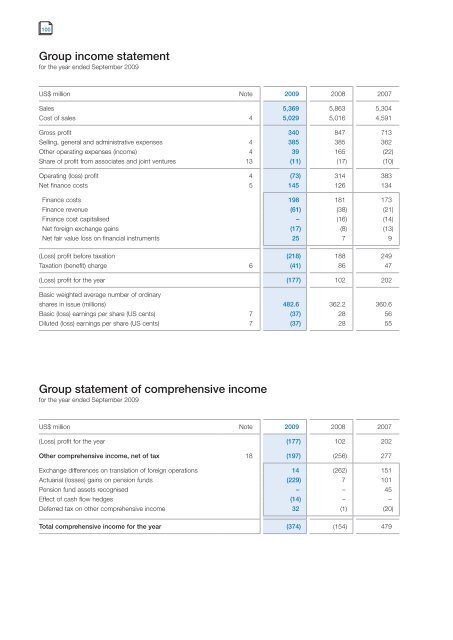
Group <strong>in</strong>come statement<br />
for the year ended September <strong>2009</strong><br />
US$ million Note <strong>2009</strong> 2008 2007<br />
Sales 5,369 5,863 5,304<br />
Cost of sales 4 5,029 5,016 4,591<br />
Gross profit 340 847 713<br />
Sell<strong>in</strong>g, general and adm<strong>in</strong>istrative expenses 4 385 385 362<br />
Other operat<strong>in</strong>g expenses (<strong>in</strong>come) 4 39 165 (22)<br />
Share of profit from associates and jo<strong>in</strong>t ventures 13 (11) (17) (10)<br />
Operat<strong>in</strong>g (loss) profit 4 (73) 314 383<br />
Net f<strong>in</strong>ance costs 5 145 126 134<br />
F<strong>in</strong>ance costs 198 181 173<br />
F<strong>in</strong>ance revenue (61) (38) (21)<br />
F<strong>in</strong>ance cost capitalised – (16) (14)<br />
Net foreign exchange ga<strong>in</strong>s (17) (8) (13)<br />
Net fair value loss on f<strong>in</strong>ancial <strong>in</strong>struments 25 7 9<br />
(Loss) profit before taxation (218) 188 249<br />
Taxation (benefit) charge 6 (41) 86 47<br />
(Loss) profit for the year (177) 102 202<br />
Basic weighted average number of ord<strong>in</strong>ary<br />
shares <strong>in</strong> issue (millions) 482.6 362.2 360.6<br />
Basic (loss) earn<strong>in</strong>gs per share (US cents) 7 (37) 28 56<br />
Diluted (loss) earn<strong>in</strong>gs per share (US cents) 7 (37) 28 55<br />
Group statement of comprehensive <strong>in</strong>come<br />
for the year ended September <strong>2009</strong><br />
US$ million Note <strong>2009</strong> 2008 2007<br />
(Loss) profit for the year (177) 102 202<br />
Other comprehensive <strong>in</strong>come, net of tax 18 (197) (256) 277<br />
Exchange differences on translation of foreign operations 14 (262) 151<br />
Actuarial (losses) ga<strong>in</strong>s on pension funds (229) 7 101<br />
Pension fund assets recognised – – 45<br />
Effect of cash flow hedges (14) – –<br />
Deferred tax on other comprehensive <strong>in</strong>come 32 (1) (20)<br />
Total comprehensive <strong>in</strong>come for the year (374) (154) 479


