

Our performance in 2009 - Sappi
Our performance in 2009 - Sappi
Our performance in 2009 - Sappi

You also want an ePaper? Increase the reach of your titles
YUMPU automatically turns print PDFs into web optimized ePapers that Google loves.
104<br />
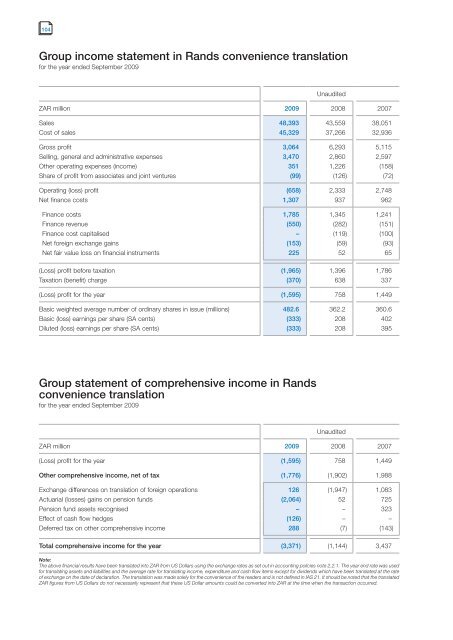
Group <strong>in</strong>come statement <strong>in</strong> Rands convenience translation<br />
for the year ended September <strong>2009</strong><br />
Unaudited<br />
ZAR million <strong>2009</strong> 2008 2007<br />
Sales 48,393 43,559 38,051<br />
Cost of sales 45,329 37,266 32,936<br />
Gross profit 3,064 6,293 5,115<br />
Sell<strong>in</strong>g, general and adm<strong>in</strong>istrative expenses 3,470 2,860 2,597<br />
Other operat<strong>in</strong>g expenses (<strong>in</strong>come) 351 1,226 (158)<br />
Share of profit from associates and jo<strong>in</strong>t ventures (99) (126) (72)<br />
Operat<strong>in</strong>g (loss) profit (658) 2,333 2,748<br />
Net f<strong>in</strong>ance costs 1,307 937 962<br />
F<strong>in</strong>ance costs 1,785 1,345 1,241<br />
F<strong>in</strong>ance revenue (550) (282) (151)<br />
F<strong>in</strong>ance cost capitalised – (119) (100)<br />
Net foreign exchange ga<strong>in</strong>s (153) (59) (93)<br />
Net fair value loss on f<strong>in</strong>ancial <strong>in</strong>struments 225 52 65<br />
(Loss) profit before taxation (1,965) 1,396 1,786<br />
Taxation (benefit) charge (370) 638 337<br />
(Loss) profit for the year (1,595) 758 1,449<br />
Basic weighted average number of ord<strong>in</strong>ary shares <strong>in</strong> issue (millions) 482.6 362.2 360.6<br />
Basic (loss) earn<strong>in</strong>gs per share (SA cents) (333) 208 402<br />
Diluted (loss) earn<strong>in</strong>gs per share (SA cents) (333) 208 395<br />
Group statement of comprehensive <strong>in</strong>come <strong>in</strong> Rands<br />
convenience translation<br />
for the year ended September <strong>2009</strong><br />
Unaudited<br />
ZAR million <strong>2009</strong> 2008 2007<br />
(Loss) profit for the year (1,595) 758 1,449<br />
Other comprehensive <strong>in</strong>come, net of tax (1,776) (1,902) 1,988<br />
Exchange differences on translation of foreign operations 126 (1,947) 1,083<br />
Actuarial (losses) ga<strong>in</strong>s on pension funds (2,064) 52 725<br />
Pension fund assets recognised – – 323<br />
Effect of cash flow hedges (126) – –<br />
Deferred tax on other comprehensive <strong>in</strong>come 288 (7) (143)<br />
Total comprehensive <strong>in</strong>come for the year (3,371) (1,144) 3,437<br />
Note:<br />
The above f<strong>in</strong>ancial results have been translated <strong>in</strong>to ZAR from US Dollars us<strong>in</strong>g the exchange rates as set out <strong>in</strong> account<strong>in</strong>g policies note 2.2.1. The year end rate was used<br />
for translat<strong>in</strong>g assets and liabilities and the average rate for translat<strong>in</strong>g <strong>in</strong>come, expenditure and cash flow items except for dividends which have been translated at the rate<br />
of exchange on the date of declaration. The translation was made solely for the convenience of the readers and is not def<strong>in</strong>ed <strong>in</strong> IAS 21. It should be noted that the translated<br />
ZAR figures from US Dollars do not necessarily represent that these US Dollar amounts could be converted <strong>in</strong>to ZAR at the time when the transaction occurred.


