

Our performance in 2009 - Sappi
Our performance in 2009 - Sappi
Our performance in 2009 - Sappi

You also want an ePaper? Increase the reach of your titles
YUMPU automatically turns print PDFs into web optimized ePapers that Google loves.
106<br />
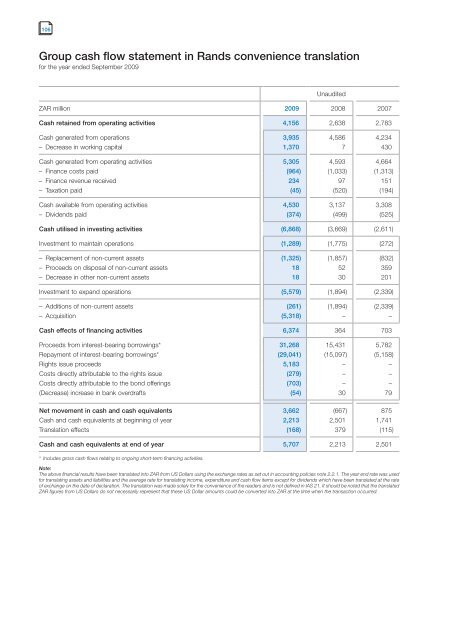
Group cash flow statement <strong>in</strong> Rands convenience translation<br />
for the year ended September <strong>2009</strong><br />
Unaudited<br />
ZAR million <strong>2009</strong> 2008 2007<br />
Cash reta<strong>in</strong>ed from operat<strong>in</strong>g activities 4,156 2,638 2,783<br />
Cash generated from operations 3,935 4,586 4,234<br />
– Decrease <strong>in</strong> work<strong>in</strong>g capital 1,370 7 430<br />
Cash generated from operat<strong>in</strong>g activities 5,305 4,593 4,664<br />
– F<strong>in</strong>ance costs paid (964) (1,033) (1,313)<br />
– F<strong>in</strong>ance revenue received 234 97 151<br />
– Taxation paid (45) (520) (194)<br />
Cash available from operat<strong>in</strong>g activities 4,530 3,137 3,308<br />
– Dividends paid (374) (499) (525)<br />
Cash utilised <strong>in</strong> <strong>in</strong>vest<strong>in</strong>g activities (6,868) (3,669) (2,611)<br />
Investment to ma<strong>in</strong>ta<strong>in</strong> operations (1,289) (1,775) (272)<br />
– Replacement of non-current assets (1,325) (1,857) (832)<br />
– Proceeds on disposal of non-current assets 18 52 359<br />
– Decrease <strong>in</strong> other non-current assets 18 30 201<br />
Investment to expand operations (5,579) (1,894) (2,339)<br />
– Additions of non-current assets (261) (1,894) (2,339)<br />
– Acquisition (5,318) – –<br />
Cash effects of f<strong>in</strong>anc<strong>in</strong>g activities 6,374 364 703<br />
Proceeds from <strong>in</strong>terest-bear<strong>in</strong>g borrow<strong>in</strong>gs* 31,268 15,431 5,782<br />
Repayment of <strong>in</strong>terest-bear<strong>in</strong>g borrow<strong>in</strong>gs* (29,041) (15,097) (5,158)<br />
Rights issue proceeds 5,183 – –<br />
Costs directly attributable to the rights issue (279) – –<br />
Costs directly attributable to the bond offer<strong>in</strong>gs (703) – –<br />
(Decrease) <strong>in</strong>crease <strong>in</strong> bank overdrafts (54) 30 79<br />
Net movement <strong>in</strong> cash and cash equivalents 3,662 (667) 875<br />
Cash and cash equivalents at beg<strong>in</strong>n<strong>in</strong>g of year 2,213 2,501 1,741<br />
Translation effects (168) 379 (115)<br />
Cash and cash equivalents at end of year 5,707 2,213 2,501<br />
* Includes gross cash flows relat<strong>in</strong>g to ongo<strong>in</strong>g short-term f<strong>in</strong>anc<strong>in</strong>g activities.<br />
Note:<br />
The above f<strong>in</strong>ancial results have been translated <strong>in</strong>to ZAR from US Dollars us<strong>in</strong>g the exchange rates as set out <strong>in</strong> account<strong>in</strong>g policies note 2.2.1. The year end rate was used<br />
for translat<strong>in</strong>g assets and liabilities and the average rate for translat<strong>in</strong>g <strong>in</strong>come, expenditure and cash flow items except for dividends which have been translated at the rate<br />
of exchange on the date of declaration. The translation was made solely for the convenience of the readers and is not def<strong>in</strong>ed <strong>in</strong> IAS 21. It should be noted that the translated<br />
ZAR figures from US Dollars do not necessarily represent that these US Dollar amounts could be converted <strong>in</strong>to ZAR at the time when the transaction occurred.


