

Our performance in 2009 - Sappi
Our performance in 2009 - Sappi
Our performance in 2009 - Sappi

You also want an ePaper? Increase the reach of your titles
YUMPU automatically turns print PDFs into web optimized ePapers that Google loves.
134<br />
Notes to the group annual f<strong>in</strong>ancial statements cont<strong>in</strong>ued<br />
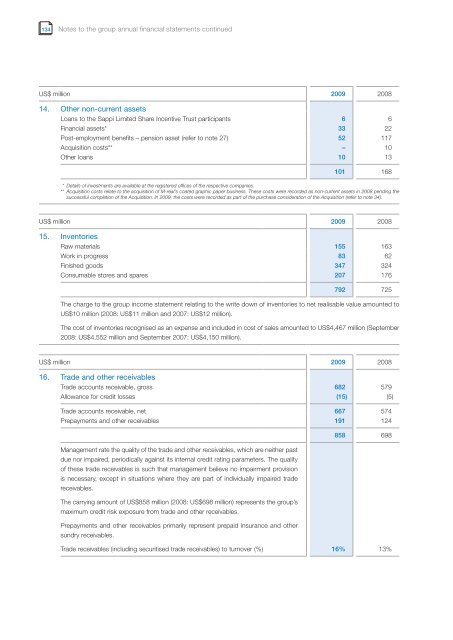
US$ million <strong>2009</strong> 2008<br />
14. Other non-current assets<br />
Loans to the <strong>Sappi</strong> Limited Share Incentive Trust participants 6 6<br />
F<strong>in</strong>ancial assets* 33 22<br />
Post-employment benefits – pension asset (refer to note 27) 52 117<br />
Acquisition costs** – 10<br />
Other loans 10 13<br />
101 168<br />
** Details of <strong>in</strong>vestments are available at the registered offices of the respective companies.<br />
** Acquisition costs relate to the acquisition of M-real’s coated graphic paper bus<strong>in</strong>ess. These costs were recorded as non-current assets <strong>in</strong> 2008 pend<strong>in</strong>g the<br />
successful completion of the Acquisition. In <strong>2009</strong>, the costs were recorded as part of the purchase consideration of the Acquisition (refer to note 34).<br />
US$ million <strong>2009</strong> 2008<br />
15. Inventories<br />
Raw materials 155 163<br />
Work <strong>in</strong> progress 83 62<br />
F<strong>in</strong>ished goods 347 324<br />
Consumable stores and spares 207 176<br />
792 725<br />
The charge to the group <strong>in</strong>come statement relat<strong>in</strong>g to the write down of <strong>in</strong>ventories to net realisable value amounted to<br />
US$10 million (2008: US$11 million and 2007: US$12 million).<br />
The cost of <strong>in</strong>ventories recognised as an expense and <strong>in</strong>cluded <strong>in</strong> cost of sales amounted to US$4,467 million (September<br />
2008: US$4,552 million and September 2007: US$4,150 million).<br />
US$ million <strong>2009</strong> 2008<br />
16. Trade and other receivables<br />
Trade accounts receivable, gross 682 579<br />
Allowance for credit losses (15) (5)<br />
Trade accounts receivable, net 667 574<br />
Prepayments and other receivables 191 124<br />
Management rate the quality of the trade and other receivables, which are neither past<br />
due nor impaired, periodically aga<strong>in</strong>st its <strong>in</strong>ternal credit rat<strong>in</strong>g parameters. The quality<br />
of these trade receivables is such that management believe no impairment provision<br />
is necessary, except <strong>in</strong> situations where they are part of <strong>in</strong>dividually impaired trade<br />
receivables.<br />
The carry<strong>in</strong>g amount of US$858 million (2008: US$698 million) represents the group’s<br />
maximum credit risk exposure from trade and other receivables.<br />
Prepayments and other receivables primarily represent prepaid <strong>in</strong>surance and other<br />
sundry receivables.<br />
858 698<br />
Trade receivables (<strong>in</strong>clud<strong>in</strong>g securitised trade receivables) to turnover (%) 16% 13%


