

Our performance in 2009 - Sappi
Our performance in 2009 - Sappi
Our performance in 2009 - Sappi

Create successful ePaper yourself
Turn your PDF publications into a flip-book with our unique Google optimized e-Paper software.
154<br />
Notes to the group annual f<strong>in</strong>ancial statements cont<strong>in</strong>ued<br />
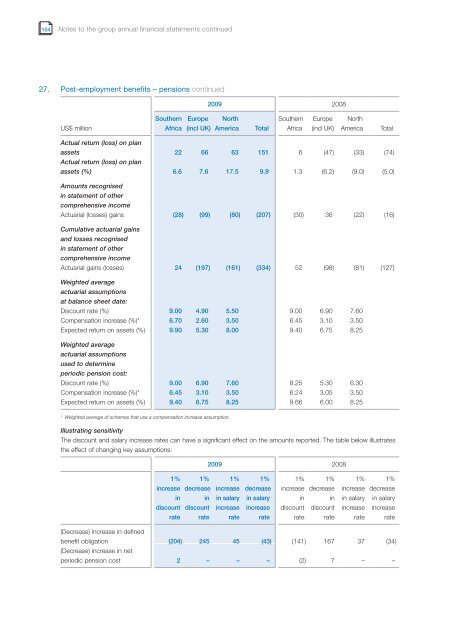
27. Post-employment benefits – pensions cont<strong>in</strong>ued<br />
US$ million<br />
Southern<br />
Africa<br />
Europe<br />
(<strong>in</strong>cl UK)<br />
<strong>2009</strong> 2008<br />
North<br />
America Total<br />
Southern<br />
Africa<br />
Europe<br />
(<strong>in</strong>cl UK)<br />
North<br />
America Total<br />
Actual return (loss) on plan<br />
assets<br />
Actual return (loss) on plan<br />
22 66 63 151 6 (47) (33) (74)<br />
assets (%) 6.6 7.6 17.5 9.9 1.3 (6.2) (9.0) (5.0)<br />
Amounts recognised<br />
<strong>in</strong> statement of other<br />
comprehensive <strong>in</strong>come<br />
Actuarial (losses) ga<strong>in</strong>s (28) (99) (80) (207) (30) 36 (22) (16)<br />
Cumulative actuarial ga<strong>in</strong>s<br />
and losses recognised<br />
<strong>in</strong> statement of other<br />
comprehensive <strong>in</strong>come<br />
Actuarial ga<strong>in</strong>s (losses) 24 (197) (161) (334) 52 (98) (81) (127)<br />
Weighted average<br />
actuarial assumptions<br />
at balance sheet date:<br />
Discount rate (%) 9.00 4.90 5.50 9.00 6.90 7.60<br />
Compensation <strong>in</strong>crease (%)* 6.70 2.60 3.50 6.45 3.10 3.50<br />
Expected return on assets (%) 9.90 5.30 8.00 9.40 6.75 8.25<br />
Weighted average<br />
actuarial assumptions<br />
used to determ<strong>in</strong>e<br />
periodic pension cost:<br />
Discount rate (%) 9.00 6.90 7.60 8.25 5.30 6.30<br />
Compensation <strong>in</strong>crease (%)* 6.45 3.10 3.50 6.24 3.05 3.50<br />
Expected return on assets (%) 9.40 6.75 8.25 9.66 6.00 8.25<br />
* Weighted average of schemes that use a compensation <strong>in</strong>crease assumption.<br />
Illustrat<strong>in</strong>g sensitivity<br />
The discount and salary <strong>in</strong>crease rates can have a significant effect on the amounts reported. The table below illustrates<br />
the effect of chang<strong>in</strong>g key assumptions:<br />
1% 1%<br />
<strong>in</strong>crease decrease<br />
<strong>in</strong> <strong>in</strong><br />
discount discount<br />
rate rate<br />
<strong>2009</strong> 2008<br />
1%<br />
<strong>in</strong>crease<br />
<strong>in</strong> salary<br />
<strong>in</strong>crease<br />
rate<br />
1%<br />
decrease<br />
<strong>in</strong> salary<br />
<strong>in</strong>crease<br />
rate<br />
1% 1%<br />
<strong>in</strong>crease decrease<br />
<strong>in</strong> <strong>in</strong><br />
discount discount<br />
rate rate<br />
1% 1%<br />
<strong>in</strong>crease decrease<br />
<strong>in</strong> salary <strong>in</strong> salary<br />
<strong>in</strong>crease <strong>in</strong>crease<br />
rate rate<br />
(Decrease) <strong>in</strong>crease <strong>in</strong> def<strong>in</strong>ed<br />
benefit obligation<br />
(Decrease) <strong>in</strong>crease <strong>in</strong> net<br />
(204) 245 45 (43) (141) 167 37 (34)<br />
periodic pension cost 2 – – – (2) 7 – –


