

Our performance in 2009 - Sappi
Our performance in 2009 - Sappi
Our performance in 2009 - Sappi

Create successful ePaper yourself
Turn your PDF publications into a flip-book with our unique Google optimized e-Paper software.
152<br />
Notes to the group annual f<strong>in</strong>ancial statements cont<strong>in</strong>ued<br />
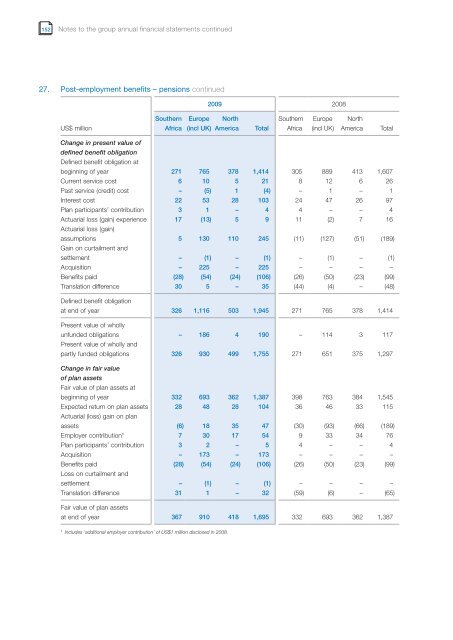
27. Post-employment benefits – pensions cont<strong>in</strong>ued<br />
US$ million<br />
Southern<br />
Africa<br />
Europe<br />
(<strong>in</strong>cl UK)<br />
<strong>2009</strong> 2008<br />
North<br />
America Total<br />
Southern<br />
Africa<br />
Europe<br />
(<strong>in</strong>cl UK)<br />
North<br />
America Total<br />
Change <strong>in</strong> present value of<br />
def<strong>in</strong>ed benefit obligation<br />
Def<strong>in</strong>ed benefit obligation at<br />
beg<strong>in</strong>n<strong>in</strong>g of year 271 765 378 1,414 305 889 413 1,607<br />
Current service cost 6 10 5 21 8 12 6 26<br />
Past service (credit) cost – (5) 1 (4) – 1 – 1<br />
Interest cost 22 53 28 103 24 47 26 97<br />
Plan participants’ contribution 3 1 – 4 4 – – 4<br />
Actuarial loss (ga<strong>in</strong>) experience<br />
Actuarial loss (ga<strong>in</strong>)<br />
17 (13) 5 9 11 (2) 7 16<br />
assumptions<br />
Ga<strong>in</strong> on curtailment and<br />
5 130 110 245 (11) (127) (51) (189)<br />
settlement – (1) – (1) – (1) – (1)<br />
Acquisition – 225 – 225 – – – –<br />
Benefits paid (28) (54) (24) (106) (26) (50) (23) (99)<br />
Translation difference 30 5 – 35 (44) (4) – (48)<br />
Def<strong>in</strong>ed benefit obligation<br />
at end of year 326 1,116 503 1,945 271 765 378 1,414<br />
Present value of wholly<br />
unfunded obligations<br />
Present value of wholly and<br />
– 186 4 190 – 114 3 117<br />
partly funded obligations 326 930 499 1,755 271 651 375 1,297<br />
Change <strong>in</strong> fair value<br />
of plan assets<br />
Fair value of plan assets at<br />
beg<strong>in</strong>n<strong>in</strong>g of year 332 693 362 1,387 398 763 384 1,545<br />
Expected return on plan assets<br />
Actuarial (loss) ga<strong>in</strong> on plan<br />
28 48 28 104 36 46 33 115<br />
assets (6) 18 35 47 (30) (93) (66) (189)<br />
Employer contribution* 7 30 17 54 9 33 34 76<br />
Plan participants’ contribution 3 2 – 5 4 – – 4<br />
Acquisition – 173 – 173 – – – –<br />
Benefits paid<br />
Loss on curtailment and<br />
(28) (54) (24) (106) (26) (50) (23) (99)<br />
settlement – (1) – (1) – – – –<br />
Translation difference 31 1 – 32 (59) (6) – (65)<br />
Fair value of plan assets<br />
at end of year 367 910 418 1,695 332 693 362 1,387<br />
* Includes ‘additional employer contribution’ of US$1 million disclosed <strong>in</strong> 2008.


