

Our performance in 2009 - Sappi
Our performance in 2009 - Sappi
Our performance in 2009 - Sappi

Create successful ePaper yourself
Turn your PDF publications into a flip-book with our unique Google optimized e-Paper software.
168<br />
Notes to the group annual f<strong>in</strong>ancial statements cont<strong>in</strong>ued<br />
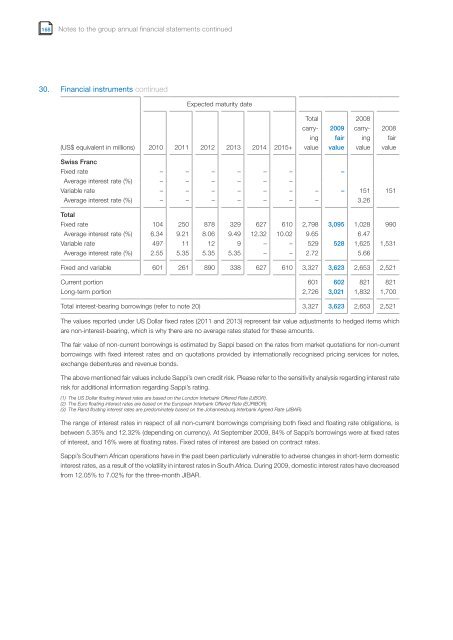
30. F<strong>in</strong>ancial <strong>in</strong>struments cont<strong>in</strong>ued<br />
(US$ equivalent <strong>in</strong> millions)<br />
Swiss Franc<br />
Expected maturity date<br />
2010 2011 2012 2013 2014 2015+<br />
Total<br />
carry-<br />
<strong>in</strong>g<br />
value<br />
<strong>2009</strong><br />
fair<br />
value<br />
Fixed rate – – – – – – –<br />
Average <strong>in</strong>terest rate (%) – – – – – –<br />
Variable rate – – – – – – – – 151 151<br />
2008<br />
carry-<br />
Average <strong>in</strong>terest rate (%) – – – – – – – 3.26<br />
Total<br />
Fixed rate 104 250 878 329 627 610 2,798 3,095 1,028 990<br />
Average <strong>in</strong>terest rate (%) 6.34 9.21 8.06 9.49 12.32 10.02 9.65 6.47<br />
Variable rate 497 11 12 9 – – 529 528 1,625 1,531<br />
Average <strong>in</strong>terest rate (%) 2.55 5.35 5.35 5.35 – – 2.72 5.66<br />
Fixed and variable 601 261 890 338 627 610 3,327 3,623 2,653 2,521<br />
Current portion 601 602 821 821<br />
Long-term portion 2,726 3,021 1,832 1,700<br />
Total <strong>in</strong>terest-bear<strong>in</strong>g borrow<strong>in</strong>gs (refer to note 20) 3,327 3,623 2,653 2,521<br />
The values reported under US Dollar fixed rates (2011 and 2013) represent fair value adjustments to hedged items which<br />
are non-<strong>in</strong>terest-bear<strong>in</strong>g, which is why there are no average rates stated for these amounts.<br />
The fair value of non-current borrow<strong>in</strong>gs is estimated by <strong>Sappi</strong> based on the rates from market quotations for non-current<br />
borrow<strong>in</strong>gs with fixed <strong>in</strong>terest rates and on quotations provided by <strong>in</strong>ternationally recognised pric<strong>in</strong>g services for notes,<br />
exchange debentures and revenue bonds.<br />
The above mentioned fair values <strong>in</strong>clude <strong>Sappi</strong>’s own credit risk. Please refer to the sensitivity analysis regard<strong>in</strong>g <strong>in</strong>terest rate<br />
risk for additional <strong>in</strong>formation regard<strong>in</strong>g <strong>Sappi</strong>’s rat<strong>in</strong>g.<br />
(1) The US Dollar float<strong>in</strong>g <strong>in</strong>terest rates are based on the London Interbank Offered Rate (LIBOR).<br />
(2) The Euro float<strong>in</strong>g <strong>in</strong>terest rates are based on the European Interbank Offered Rate (EURIBOR).<br />
(3) The Rand float<strong>in</strong>g <strong>in</strong>terest rates are predom<strong>in</strong>ately based on the Johannesburg Interbank Agreed Rate (JIBAR).<br />
The range of <strong>in</strong>terest rates <strong>in</strong> respect of all non-current borrow<strong>in</strong>gs compris<strong>in</strong>g both fixed and float<strong>in</strong>g rate obligations, is<br />
between 5.35% and 12.32% (depend<strong>in</strong>g on currency). At September <strong>2009</strong>, 84% of <strong>Sappi</strong>’s borrow<strong>in</strong>gs were at fixed rates<br />
of <strong>in</strong>terest, and 16% were at float<strong>in</strong>g rates. Fixed rates of <strong>in</strong>terest are based on contract rates.<br />
<strong>Sappi</strong>’s Southern African operations have <strong>in</strong> the past been particularly vulnerable to adverse changes <strong>in</strong> short-term domestic<br />
<strong>in</strong>terest rates, as a result of the volatility <strong>in</strong> <strong>in</strong>terest rates <strong>in</strong> South Africa. Dur<strong>in</strong>g <strong>2009</strong>, domestic <strong>in</strong>terest rates have decreased<br />
from 12.05% to 7.02% for the three-month JIBAR.<br />
<strong>in</strong>g<br />
value<br />
2008<br />
fair<br />
value


