

Our performance in 2009 - Sappi
Our performance in 2009 - Sappi
Our performance in 2009 - Sappi

Create successful ePaper yourself
Turn your PDF publications into a flip-book with our unique Google optimized e-Paper software.
4<br />
<strong>Our</strong> <strong>performance</strong> <strong>in</strong> <strong>2009</strong><br />
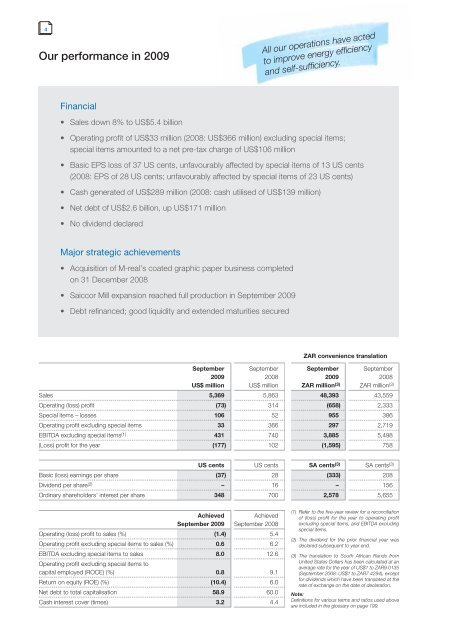
F<strong>in</strong>ancial<br />
Sales down 8% to US$5.4 billion<br />
All our operations have acted<br />
to improve energy efficiency<br />
and self-sufficiency.<br />
Operat<strong>in</strong>g profit of US$33 million (2008: US$366 million) exclud<strong>in</strong>g special items;<br />
special items amounted to a net pre-tax charge of US$106 million<br />
Basic EPS loss of 37 US cents, unfavourably affected by special items of 13 US cents<br />
(2008: EPS of 28 US cents; unfavourably affected by special items of 23 US cents)<br />
Cash generated of US$289 million (2008: cash utilised of US$139 million)<br />
Net debt of US$2.6 billion, up US$171 million<br />
No dividend declared<br />
Major strategic achievements<br />
Acquisition of M-real’s coated graphic paper bus<strong>in</strong>ess completed<br />
on 31 December 2008<br />
Saiccor Mill expansion reached full production <strong>in</strong> September <strong>2009</strong><br />
Debt ref<strong>in</strong>anced; good liquidity and extended maturities secured<br />
ZAR convenience translation<br />
September September September September<br />
<strong>2009</strong> 2008 <strong>2009</strong> 2008<br />
US$ million US$ million ZAR million (3) ZAR million (3)<br />
Sales 5,369 5,863 48,393 43,559<br />
Operat<strong>in</strong>g (loss) profit (73) 314 (658) 2,333<br />
Special items – losses 106 52 955 386<br />
Operat<strong>in</strong>g profit exclud<strong>in</strong>g special items 33 366 297 2,719<br />
EBITDA exclud<strong>in</strong>g special items (1) 431 740 3,885 5,498<br />
(Loss) profit for the year (177) 102 (1,595) 758<br />
US cents US cents SA cents (3) SA cents (3)<br />
Basic (loss) earn<strong>in</strong>gs per share (37) 28 (333) 208<br />
Dividend per share (2) – 16 – 156<br />
Ord<strong>in</strong>ary shareholders’ <strong>in</strong>terest per share 348 700 2,578 5,655<br />
Achieved Achieved<br />
September <strong>2009</strong> September 2008<br />
Operat<strong>in</strong>g (loss) profit to sales (%) (1.4) 5.4<br />
Operat<strong>in</strong>g profit exclud<strong>in</strong>g special items to sales (%) 0.6 6.2<br />
EBITDA exclud<strong>in</strong>g special items to sales<br />
Operat<strong>in</strong>g profit exclud<strong>in</strong>g special items to<br />
8.0 12.6<br />
capital employed (ROCE) (%) 0.8 9.1<br />
Return on equity (ROE) (%) (10.4) 6.0<br />
Net debt to total capitalisation 58.9 60.0<br />
Cash <strong>in</strong>terest cover (times) 3.2 4.4<br />
(1) Refer to the five-year review for a reconciliation<br />
of (loss) profit for the year to operat<strong>in</strong>g profit<br />
exclud<strong>in</strong>g special items, and EBITDA exclud<strong>in</strong>g<br />
special items.<br />
(2) The dividend for the prior f<strong>in</strong>ancial year was<br />
declared subsequent to year end.<br />
(3) The translation to South African Rands from<br />
United States Dollars has been calculated at an<br />
average rate for the year of US$1 to ZAR9.0135<br />
(September 2008: US$1 to ZAR7.4294), except<br />
for dividends which have been translated at the<br />
rate of exchange on the date of declaration.<br />
Note:<br />
Def<strong>in</strong>itions for various terms and ratios used above<br />
are <strong>in</strong>cluded <strong>in</strong> the glossary on page 199.


