

Our performance in 2009 - Sappi
Our performance in 2009 - Sappi
Our performance in 2009 - Sappi

You also want an ePaper? Increase the reach of your titles
YUMPU automatically turns print PDFs into web optimized ePapers that Google loves.
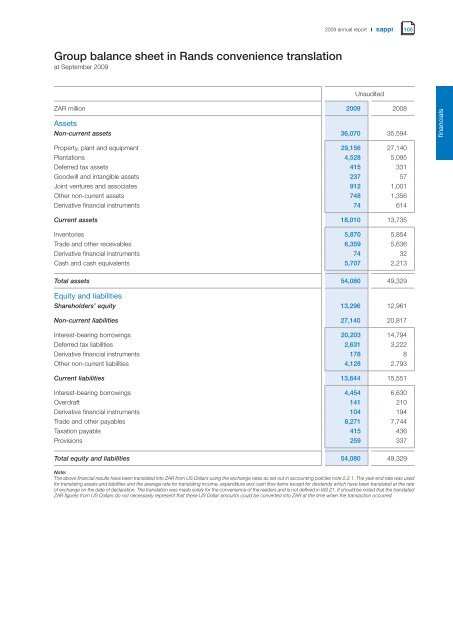
Group balance sheet <strong>in</strong> Rands convenience translation<br />
at September <strong>2009</strong><br />
<strong>2009</strong> annual report<br />
Unaudited<br />
ZAR million <strong>2009</strong> 2008<br />
Assets<br />
Non-current assets 36,070 35,594<br />
Property, plant and equipment 29,156 27,140<br />
Plantations 4,528 5,095<br />
Deferred tax assets 415 331<br />
Goodwill and <strong>in</strong>tangible assets 237 57<br />
Jo<strong>in</strong>t ventures and associates 912 1,001<br />
Other non-current assets 748 1,356<br />
Derivative f<strong>in</strong>ancial <strong>in</strong>struments 74 614<br />
Current assets 18,010 13,735<br />
Inventories 5,870 5,854<br />
Trade and other receivables 6,359 5,636<br />
Derivative f<strong>in</strong>ancial <strong>in</strong>struments 74 32<br />
Cash and cash equivalents 5,707 2,213<br />
Total assets 54,080 49,329<br />
Equity and liabilities<br />
Shareholders’ equity 13,296 12,961<br />
Non-current liabilities 27,140 20,817<br />
Interest-bear<strong>in</strong>g borrow<strong>in</strong>gs 20,203 14,794<br />
Deferred tax liabilities 2,631 3,222<br />
Derivative f<strong>in</strong>ancial <strong>in</strong>struments 178 8<br />
Other non-current liabilities 4,128 2,793<br />
Current liabilities 13,644 15,551<br />
Interest-bear<strong>in</strong>g borrow<strong>in</strong>gs 4,454 6,630<br />
Overdraft 141 210<br />
Derivative f<strong>in</strong>ancial <strong>in</strong>struments 104 194<br />
Trade and other payables 8,271 7,744<br />
Taxation payable 415 436<br />
Provisions 259 337<br />
Total equity and liabilities 54,080 49,329<br />
Note:<br />
The above f<strong>in</strong>ancial results have been translated <strong>in</strong>to ZAR from US Dollars us<strong>in</strong>g the exchange rates as set out <strong>in</strong> account<strong>in</strong>g policies note 2.2.1. The year end rate was used<br />
for translat<strong>in</strong>g assets and liabilities and the average rate for translat<strong>in</strong>g <strong>in</strong>come, expenditure and cash flow items except for dividends which have been translated at the rate<br />
of exchange on the date of declaration. The translation was made solely for the convenience of the readers and is not def<strong>in</strong>ed <strong>in</strong> IAS 21. It should be noted that the translated<br />
ZAR figures from US Dollars do not necessarily represent that these US Dollar amounts could be converted <strong>in</strong>to ZAR at the time when the transaction occurred.<br />
105<br />
f<strong>in</strong>ancials


