

Our performance in 2009 - Sappi
Our performance in 2009 - Sappi
Our performance in 2009 - Sappi

Create successful ePaper yourself
Turn your PDF publications into a flip-book with our unique Google optimized e-Paper software.
<strong>2009</strong> annual report<br />
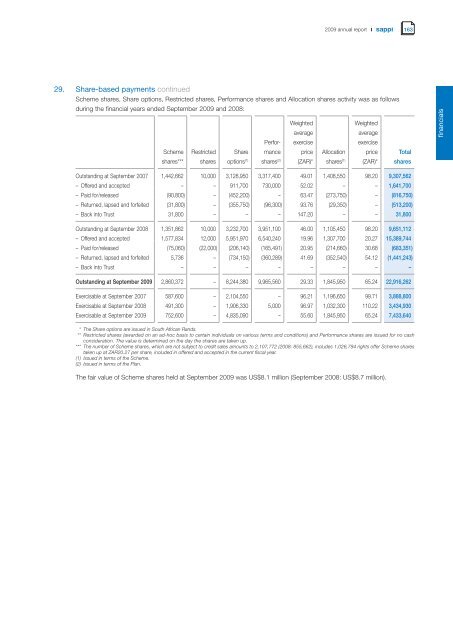
29. Share-based payments cont<strong>in</strong>ued<br />
Scheme shares, Share options, Restricted shares, Performance shares and Allocation shares activity was as follows<br />
dur<strong>in</strong>g the f<strong>in</strong>ancial years ended September <strong>2009</strong> and 2008:<br />
Scheme<br />
shares***<br />
Restricted<br />
shares<br />
Share<br />
options (1)<br />
Perfor-<br />
mance<br />
shares (2)<br />
Weighted<br />
average<br />
exercise<br />
price<br />
(ZAR)*<br />
Allocation<br />
shares (1)<br />
Weighted<br />
average<br />
exercise<br />
price<br />
(ZAR)*<br />
163<br />
Total<br />
shares<br />
Outstand<strong>in</strong>g at September 2007 1,442,662 10,000 3,128,950 3,317,400 49.01 1,408,550 98.20 9,307,562<br />
– Offered and accepted – – 911,700 730,000 52.02 – – 1,641,700<br />
– Paid for/released (90,800) – (452,200) – 63.47 (273,750) – (816,750)<br />
– Returned, lapsed and forfeited (31,800) – (355,750) (96,300) 93.76 (29,350) – (513,200)<br />
– Back <strong>in</strong>to Trust 31,800 – – – 147.20 – – 31,800<br />
Outstand<strong>in</strong>g at September 2008 1,351,862 10,000 3,232,700 3,951,100 46.00 1,105,450 98.20 9,651,112<br />
– Offered and accepted 1,577,834 12,000 5,951,970 6,540,240 19.96 1,307,700 20.27 15,389,744<br />
– Paid for/released (75,060) (22,000) (206,140) (165,491) 20.95 (214,660) 30.68 (683,351)<br />
– Returned, lapsed and forfeited 5,736 – (734,150) (360,289) 41.69 (352,540) 54.12 (1,441,243)<br />
– Back <strong>in</strong>to Trust – – – – – – – –<br />
Outstand<strong>in</strong>g at September <strong>2009</strong> 2,860,372 – 8,244,380 9,965,560 29.33 1,845,950 65.24 22,916,262<br />
Exercisable at September 2007 587,600 – 2,104,550 – 96.21 1,196,650 99.71 3,888,800<br />
Exercisable at September 2008 491,300 – 1,906,330 5,000 96.97 1,032,300 110.22 3,434,930<br />
Exercisable at September <strong>2009</strong> 752,600 – 4,835,090 – 55.60 1,845,950 65.24 7,433,640<br />
*** The Share options are issued <strong>in</strong> South African Rands.<br />
*** Restricted shares (awarded on an ad-hoc basis to certa<strong>in</strong> <strong>in</strong>dividuals on various terms and conditions) and Performance shares are issued for no cash<br />
consideration. The value is determ<strong>in</strong>ed on the day the shares are taken up.<br />
*** The number of Scheme shares, which are not subject to credit sales amounts to 2,107,772 (2008: 855,662), <strong>in</strong>cludes 1,026,794 rights offer Scheme shares<br />
taken up at ZAR20.27 per share, <strong>in</strong>cluded <strong>in</strong> offered and accepted <strong>in</strong> the current fiscal year.<br />
(1) Issued <strong>in</strong> terms of the Scheme.<br />
(2) Issued <strong>in</strong> terms of the Plan.<br />
The fair value of Scheme shares held at September <strong>2009</strong> was US$8.1 million (September 2008: US$8.7 million).<br />
f<strong>in</strong>ancials


