

Our performance in 2009 - Sappi
Our performance in 2009 - Sappi
Our performance in 2009 - Sappi

Create successful ePaper yourself
Turn your PDF publications into a flip-book with our unique Google optimized e-Paper software.
102<br />
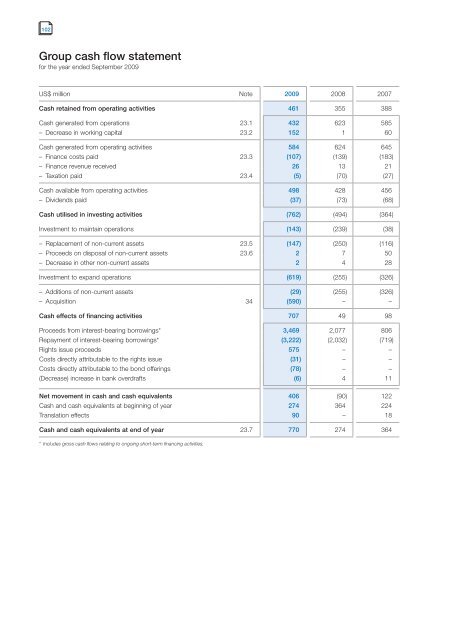
Group cash flow statement<br />
for the year ended September <strong>2009</strong><br />
US$ million Note <strong>2009</strong> 2008 2007<br />
Cash reta<strong>in</strong>ed from operat<strong>in</strong>g activities 461 355 388<br />
Cash generated from operations 23.1 432 623 585<br />
– Decrease <strong>in</strong> work<strong>in</strong>g capital 23.2 152 1 60<br />
Cash generated from operat<strong>in</strong>g activities 584 624 645<br />
– F<strong>in</strong>ance costs paid 23.3 (107) (139) (183)<br />
– F<strong>in</strong>ance revenue received 26 13 21<br />
– Taxation paid 23.4 (5) (70) (27)<br />
Cash available from operat<strong>in</strong>g activities 498 428 456<br />
– Dividends paid (37) (73) (68)<br />
Cash utilised <strong>in</strong> <strong>in</strong>vest<strong>in</strong>g activities (762) (494) (364)<br />
Investment to ma<strong>in</strong>ta<strong>in</strong> operations (143) (239) (38)<br />
– Replacement of non-current assets 23.5 (147) (250) (116)<br />
– Proceeds on disposal of non-current assets 23.6 2 7 50<br />
– Decrease <strong>in</strong> other non-current assets 2 4 28<br />
Investment to expand operations (619) (255) (326)<br />
– Additions of non-current assets (29) (255) (326)<br />
– Acquisition 34 (590) – –<br />
Cash effects of f<strong>in</strong>anc<strong>in</strong>g activities 707 49 98<br />
Proceeds from <strong>in</strong>terest-bear<strong>in</strong>g borrow<strong>in</strong>gs* 3,469 2,077 806<br />
Repayment of <strong>in</strong>terest-bear<strong>in</strong>g borrow<strong>in</strong>gs* (3,222) (2,032) (719)<br />
Rights issue proceeds 575 – –<br />
Costs directly attributable to the rights issue (31) – –<br />
Costs directly attributable to the bond offer<strong>in</strong>gs (78) – –<br />
(Decrease) <strong>in</strong>crease <strong>in</strong> bank overdrafts (6) 4 11<br />
Net movement <strong>in</strong> cash and cash equivalents 406 (90) 122<br />
Cash and cash equivalents at beg<strong>in</strong>n<strong>in</strong>g of year 274 364 224<br />
Translation effects 90 – 18<br />
Cash and cash equivalents at end of year 23.7 770 274 364<br />
* Includes gross cash flows relat<strong>in</strong>g to ongo<strong>in</strong>g short-term f<strong>in</strong>anc<strong>in</strong>g activities.


