Our performance in 2009 - Sappi
Our performance in 2009 - Sappi
Our performance in 2009 - Sappi
You also want an ePaper? Increase the reach of your titles
YUMPU automatically turns print PDFs into web optimized ePapers that Google loves.
46 Chief f<strong>in</strong>ancial officer’s report cont<strong>in</strong>ued<br />
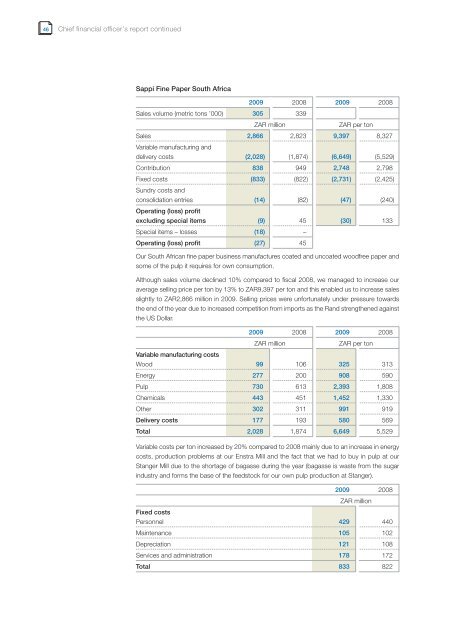
<strong>Sappi</strong> F<strong>in</strong>e Paper South Africa<br />
<strong>2009</strong> 2008 <strong>2009</strong> 2008<br />
Sales volume (metric tons ’000) 305 339<br />
ZAR million ZAR per ton<br />
Sales<br />
Variable manufactur<strong>in</strong>g and<br />
2,866 2,823 9,397 8,327<br />
delivery costs (2,028) (1,874) (6,649) (5,529)<br />
Contribution 838 949 2,748 2,798<br />
Fixed costs<br />
Sundry costs and<br />
(833) (822) (2,731) (2,425)<br />
consolidation entries<br />
Operat<strong>in</strong>g (loss) profit<br />
(14) (82) (47) (240)<br />
exclud<strong>in</strong>g special items (9) 45 (30) 133<br />
Special items – losses (18) –<br />
Operat<strong>in</strong>g (loss) profit (27) 45<br />
<strong>Our</strong> South African f<strong>in</strong>e paper bus<strong>in</strong>ess manufactures coated and uncoated woodfree paper and<br />
some of the pulp it requires for own consumption.<br />
Although sales volume decl<strong>in</strong>ed 10% compared to fiscal 2008, we managed to <strong>in</strong>crease our<br />
average sell<strong>in</strong>g price per ton by 13% to ZAR9,397 per ton and this enabled us to <strong>in</strong>crease sales<br />
slightly to ZAR2,866 million <strong>in</strong> <strong>2009</strong>. Sell<strong>in</strong>g prices were unfortunately under pressure towards<br />
the end of the year due to <strong>in</strong>creased competition from imports as the Rand strengthened aga<strong>in</strong>st<br />
the US Dollar.<br />
<strong>2009</strong> 2008 <strong>2009</strong> 2008<br />
ZAR million ZAR per ton<br />
Variable manufactur<strong>in</strong>g costs<br />
Wood 99 106 325 313<br />
Energy 277 200 908 590<br />
Pulp 730 613 2,393 1,808<br />
Chemicals 443 451 1,452 1,330<br />
Other 302 311 991 919<br />
Delivery costs 177 193 580 569<br />
Total 2,028 1,874 6,649 5,529<br />
Variable costs per ton <strong>in</strong>creased by 20% compared to 2008 ma<strong>in</strong>ly due to an <strong>in</strong>crease <strong>in</strong> energy<br />
costs, production problems at our Enstra Mill and the fact that we had to buy <strong>in</strong> pulp at our<br />
Stanger Mill due to the shortage of bagasse dur<strong>in</strong>g the year (bagasse is waste from the sugar<br />
<strong>in</strong>dustry and forms the base of the feedstock for our own pulp production at Stanger).<br />
<strong>2009</strong><br />
ZAR million<br />
2008<br />
Fixed costs<br />
Personnel 429 440<br />
Ma<strong>in</strong>tenance 105 102<br />
Depreciation 121 108<br />
Services and adm<strong>in</strong>istration 178 172<br />
Total 833 822


