

Our performance in 2009 - Sappi
Our performance in 2009 - Sappi
Our performance in 2009 - Sappi

Create successful ePaper yourself
Turn your PDF publications into a flip-book with our unique Google optimized e-Paper software.
As <strong>in</strong> the case of the other regions, the South African bus<strong>in</strong>esses also places great emphasis on<br />
the management of fixed costs. We were able to conta<strong>in</strong> fixed costs to a 1% <strong>in</strong>crease over 2008<br />
through various cost reduction actions.<br />
As of fiscal 2010, <strong>Sappi</strong> F<strong>in</strong>e Paper South Africa will be <strong>in</strong>corporated <strong>in</strong>to the <strong>Sappi</strong> Forest<br />
Products division. We do not consider this change <strong>in</strong> our future report<strong>in</strong>g to be material.<br />
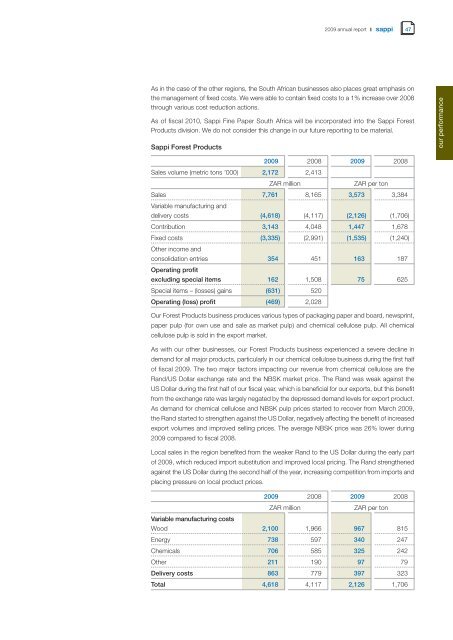
<strong>Sappi</strong> Forest Products<br />
<strong>2009</strong> annual report 47<br />
<strong>2009</strong> 2008 <strong>2009</strong> 2008<br />
Sales volume (metric tons ’000) 2,172 2,413<br />
ZAR million ZAR per ton<br />
Sales<br />
Variable manufactur<strong>in</strong>g and<br />
7,761 8,165 3,573 3,384<br />
delivery costs (4,618) (4,117) (2,126) (1,706)<br />
Contribution 3,143 4,048 1,447 1,678<br />
Fixed costs<br />
Other <strong>in</strong>come and<br />
(3,335) (2,991) (1,535) (1,240)<br />
consolidation entries<br />
Operat<strong>in</strong>g profit<br />
354 451 163 187<br />
exclud<strong>in</strong>g special items 162 1,508 75 625<br />
Special items – (losses) ga<strong>in</strong>s (631) 520<br />
Operat<strong>in</strong>g (loss) profit (469) 2,028<br />
<strong>Our</strong> Forest Products bus<strong>in</strong>ess produces various types of packag<strong>in</strong>g paper and board, newspr<strong>in</strong>t,<br />
paper pulp (for own use and sale as market pulp) and chemical cellulose pulp. All chemical<br />
cellulose pulp is sold <strong>in</strong> the export market.<br />
As with our other bus<strong>in</strong>esses, our Forest Products bus<strong>in</strong>ess experienced a severe decl<strong>in</strong>e <strong>in</strong><br />
demand for all major products, particularly <strong>in</strong> our chemical cellulose bus<strong>in</strong>ess dur<strong>in</strong>g the first half<br />
of fiscal <strong>2009</strong>. The two major factors impact<strong>in</strong>g our revenue from chemical cellulose are the<br />
Rand/US Dollar exchange rate and the NBSK market price. The Rand was weak aga<strong>in</strong>st the<br />
US Dollar dur<strong>in</strong>g the first half of our fiscal year, which is beneficial for our exports, but this benefit<br />
from the exchange rate was largely negated by the depressed demand levels for export product.<br />
As demand for chemical cellulose and NBSK pulp prices started to recover from March <strong>2009</strong>,<br />
the Rand started to strengthen aga<strong>in</strong>st the US Dollar, negatively affect<strong>in</strong>g the benefit of <strong>in</strong>creased<br />
export volumes and improved sell<strong>in</strong>g prices. The average NBSK price was 26% lower dur<strong>in</strong>g<br />
<strong>2009</strong> compared to fiscal 2008.<br />
Local sales <strong>in</strong> the region benefited from the weaker Rand to the US Dollar dur<strong>in</strong>g the early part<br />
of <strong>2009</strong>, which reduced import substitution and improved local pric<strong>in</strong>g. The Rand strengthened<br />
aga<strong>in</strong>st the US Dollar dur<strong>in</strong>g the second half of the year, <strong>in</strong>creas<strong>in</strong>g competition from imports and<br />
plac<strong>in</strong>g pressure on local product prices.<br />
<strong>2009</strong> 2008 <strong>2009</strong> 2008<br />
ZAR million ZAR per ton<br />
Variable manufactur<strong>in</strong>g costs<br />
Wood 2,100 1,966 967 815<br />
Energy 738 597 340 247<br />
Chemicals 706 585 325 242<br />
Other 211 190 97 79<br />
Delivery costs 863 779 397 323<br />
Total 4,618 4,117 2,126 1,706<br />
our <strong>performance</strong>


