

Our performance in 2009 - Sappi
Our performance in 2009 - Sappi
Our performance in 2009 - Sappi

Create successful ePaper yourself
Turn your PDF publications into a flip-book with our unique Google optimized e-Paper software.
<strong>2009</strong> annual report 65<br />
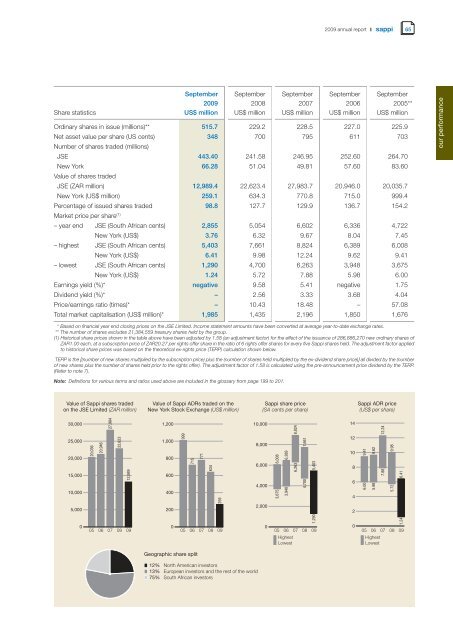
September September September September September<br />
<strong>2009</strong> 2008 2007 2006 2005**<br />
Share statistics US$ million US$ million US$ million US$ million US$ million<br />
Ord<strong>in</strong>ary shares <strong>in</strong> issue (millions)** 515.7 229.2 228.5 227.0 225.9<br />
Net asset value per share (US cents)<br />
Number of shares traded (millions)<br />
348 700 795 611 703<br />
JSE 443.40 241.58 246.95 252.60 264.70<br />
New York<br />
Value of shares traded<br />
66.28 51.04 49.81 57.60 83.60<br />
JSE (ZAR million) 12,989.4 22,623.4 27,983.7 20,946.0 20,035.7<br />
New York (US$ million) 259.1 634.3 770.8 715.0 999.4<br />
Percentage of issued shares traded<br />
Market price per share<br />
98.8 127.7 129.9 136.7 154.2<br />
(1)<br />
– year end JSE (South African cents) 2,855 5,054 6,602 6,336 4,722<br />
New York (US$) 3.76 6.32 9.67 8.04 7.45<br />
– highest JSE (South African cents) 5,403 7,661 8,824 6,389 6,008<br />
New York (US$) 6.41 9.98 12.24 9.62 9.41<br />
– lowest JSE (South African cents) 1,290 4,700 6,263 3,948 3,675<br />
New York (US$) 1.24 5.72 7.88 5.98 6.00<br />
Earn<strong>in</strong>gs yield (%)* negative 9.58 5.41 negative 1.75<br />
Dividend yield (%)* – 2.56 3.33 3.68 4.04<br />
Price/earn<strong>in</strong>gs ratio (times)* – 10.43 18.48 – 57.08<br />
Total market capitalisation (US$ million)* 1,985 1,435 2,196 1,850 1,676<br />
* Based on f<strong>in</strong>ancial year end clos<strong>in</strong>g prices on the JSE Limited. Income statement amounts have been converted at average year-to-date exchange rates.<br />
** The number of shares excludes 21,384,559 treasury shares held by the group.<br />
(1) Historical share prices shown <strong>in</strong> the table above have been adjusted by 1.58 (an adjustment factor) for the effect of the issuance of 286,886,270 new ord<strong>in</strong>ary shares of<br />
ZAR1.00 each, at a subscription price of ZAR20.27 per rights offer share <strong>in</strong> the ratio of 6 rights offer shares for every five <strong>Sappi</strong> shares held. The adjustment factor applied<br />
to historical share prices was based on the theoretical ex-rights price (TERP) calculation shown below.<br />
TERP is the [(number of new shares multiplied by the subscription price) plus the (number of shares held multiplied by the ex-dividend share price)] all divided by the (number<br />
of new shares plus the number of shares held prior to the rights offer). The adjustment factor of 1.58 is calculated us<strong>in</strong>g the pre-announcement price dividend by the TERP.<br />
(Refer to note 7).<br />
Note: Def<strong>in</strong>itions for various terms and ratios used above are <strong>in</strong>cluded <strong>in</strong> the glossary from page 199 to 201.<br />
our <strong>performance</strong>


