

Our performance in 2009 - Sappi
Our performance in 2009 - Sappi
Our performance in 2009 - Sappi

You also want an ePaper? Increase the reach of your titles
YUMPU automatically turns print PDFs into web optimized ePapers that Google loves.
120<br />
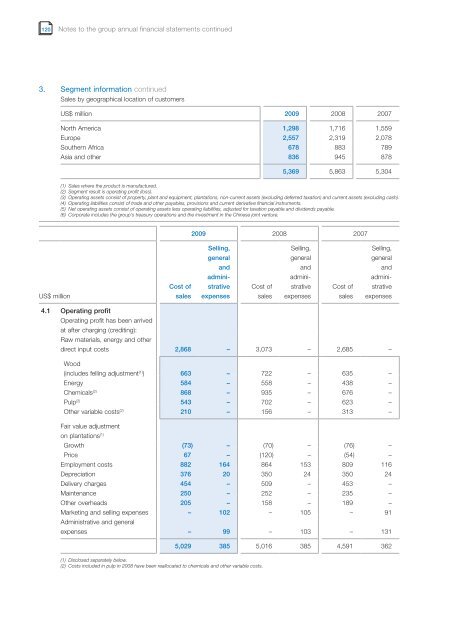
3. Segment <strong>in</strong>formation cont<strong>in</strong>ued<br />
Sales by geographical location of customers<br />
US$ million<br />
Notes to the group annual f<strong>in</strong>ancial statements cont<strong>in</strong>ued<br />
US$ million <strong>2009</strong> 2008 2007<br />
North America 1,298 1,716 1,559<br />
Europe 2,557 2,319 2,078<br />
Southern Africa 678 883 789<br />
Asia and other 836 945 878<br />
5,369 5,863 5,304<br />
(1) Sales where the product is manufactured.<br />
(2) Segment result is operat<strong>in</strong>g profit (loss).<br />
(3) Operat<strong>in</strong>g assets consist of property, plant and equipment, plantations, non-current assets (exclud<strong>in</strong>g deferred taxation) and current assets (exclud<strong>in</strong>g cash).<br />
(4) Operat<strong>in</strong>g liabilities consist of trade and other payables, provisions and current derivative f<strong>in</strong>ancial <strong>in</strong>struments.<br />
(5) Net operat<strong>in</strong>g assets consist of operat<strong>in</strong>g assets less operat<strong>in</strong>g liabilities, adjusted for taxation payable and dividends payable.<br />
(6) Corporate <strong>in</strong>cludes the group’s treasury operations and the <strong>in</strong>vestment <strong>in</strong> the Ch<strong>in</strong>ese jo<strong>in</strong>t venture.<br />
4.1 Operat<strong>in</strong>g profit<br />
Operat<strong>in</strong>g profit has been arrived<br />
at after charg<strong>in</strong>g (credit<strong>in</strong>g):<br />
Raw materials, energy and other<br />
Cost of<br />
sales<br />
<strong>2009</strong> 2008 2007<br />
Sell<strong>in</strong>g,<br />
general<br />
and<br />
adm<strong>in</strong>i-<br />
strative<br />
expenses<br />
Cost of<br />
sales<br />
Sell<strong>in</strong>g,<br />
general<br />
and<br />
adm<strong>in</strong>i-<br />
strative<br />
expenses<br />
Cost of<br />
sales<br />
Sell<strong>in</strong>g,<br />
general<br />
and<br />
adm<strong>in</strong>i-<br />
strative<br />
expenses<br />
direct <strong>in</strong>put costs 2,868 – 3,073 – 2,685 –<br />
Wood<br />
(<strong>in</strong>cludes fell<strong>in</strong>g adjustment (1) ) 663 – 722 – 635 –<br />
Energy 584 – 558 – 438 –<br />
Chemicals (2) 868 – 935 – 676 –<br />
Pulp (2) 543 – 702 – 623 –<br />
Other variable costs (2) 210 – 156 – 313 –<br />
Fair value adjustment<br />
on plantations (1)<br />
Growth (73) – (70) – (76) –<br />
Price 67 – (120) – (54) –<br />
Employment costs 882 164 864 153 809 116<br />
Depreciation 376 20 350 24 350 24<br />
Delivery charges 454 – 509 – 453 –<br />
Ma<strong>in</strong>tenance 250 – 252 – 235 –<br />
Other overheads 205 – 158 – 189 –<br />
Market<strong>in</strong>g and sell<strong>in</strong>g expenses<br />
Adm<strong>in</strong>istrative and general<br />
– 102 – 105 – 91<br />
expenses – 99 – 103 – 131<br />
(1) Disclosed separately below.<br />
(2) Costs <strong>in</strong>cluded <strong>in</strong> pulp <strong>in</strong> 2008 have been reallocated to chemicals and other variable costs.<br />
5,029 385 5,016 385 4,591 362


