

Our performance in 2009 - Sappi
Our performance in 2009 - Sappi
Our performance in 2009 - Sappi

Create successful ePaper yourself
Turn your PDF publications into a flip-book with our unique Google optimized e-Paper software.
<strong>2009</strong> annual report 63<br />
September September September September September<br />
<strong>2009</strong> 2008 2007 2006 2005**<br />
US$ million US$ million US$ million US$ million US$ million<br />
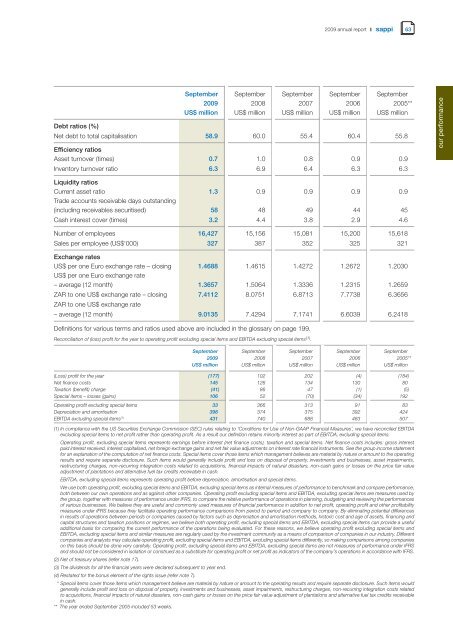
Debt ratios (%)<br />
Net debt to total capitalisation 58.9 60.0 55.4 60.4 55.8<br />
Efficiency ratios<br />
Asset turnover (times) 0.7 1.0 0.8 0.9 0.9<br />
Inventory turnover ratio 6.3 6.9 6.4 6.3 6.3<br />
Liquidity ratios<br />
Current asset ratio<br />
Trade accounts receivable days outstand<strong>in</strong>g<br />
1.3 0.9 0.9 0.9 0.9<br />
(<strong>in</strong>clud<strong>in</strong>g receivables securitised) 58 48 49 44 45<br />
Cash <strong>in</strong>terest cover (times) 3.2 4.4 3.8 2.9 4.6<br />
Number of employees 16,427 15,156 15,081 15,200 15,618<br />
Sales per employee (US$’000) 327 387 352 325 321<br />
Exchange rates<br />
US$ per one Euro exchange rate – clos<strong>in</strong>g<br />
US$ per one Euro exchange rate<br />
1.4688 1.4615 1.4272 1.2672 1.2030<br />
– average (12 month) 1.3657 1.5064 1.3336 1.2315 1.2659<br />
ZAR to one US$ exchange rate – clos<strong>in</strong>g<br />
ZAR to one US$ exchange rate<br />
7.4112 8.0751 6.8713 7.7738 6.3656<br />
– average (12 month) 9.0135 7.4294 7.1741 6.6039 6.2418<br />
Def<strong>in</strong>itions for various terms and ratios used above are <strong>in</strong>cluded <strong>in</strong> the glossary on page 199.<br />
Reconciliation of (loss) profit for the year to operat<strong>in</strong>g profit exclud<strong>in</strong>g special items and EBITDA exclud<strong>in</strong>g special items (1) .<br />
September September September September September<br />
<strong>2009</strong> 2008 2007 2006 2005**<br />
US$ million US$ million US$ million US$ million US$ million<br />
(Loss) profit for the year (177) 102 202 (4) (184)<br />
Net f<strong>in</strong>ance costs 145 126 134 130 80<br />
Taxation (benefit) charge (41) 86 47 (1) (5)<br />
Special items – losses (ga<strong>in</strong>s) 106 52 (70) (34) 192<br />
Operat<strong>in</strong>g profit exclud<strong>in</strong>g special items 33 366 313 91 83<br />
Depreciation and amortisation 398 374 375 392 424<br />
EBITDA exclud<strong>in</strong>g special items (1) 431 740 688 483 507<br />
(1) In compliance with the US Securities Exchange Commission (SEC) rules relat<strong>in</strong>g to ‘Conditions for Use of Non-GAAP F<strong>in</strong>ancial Measures’, we have reconciled EBITDA<br />
exclud<strong>in</strong>g special items to net profit rather than operat<strong>in</strong>g profit. As a result our def<strong>in</strong>ition reta<strong>in</strong>s m<strong>in</strong>ority <strong>in</strong>terest as part of EBITDA, exclud<strong>in</strong>g special items.<br />
Operat<strong>in</strong>g profit, exclud<strong>in</strong>g special items represents earn<strong>in</strong>gs before <strong>in</strong>terest (net f<strong>in</strong>ance costs), taxation and special items. Net f<strong>in</strong>ance costs <strong>in</strong>cludes: gross <strong>in</strong>terest<br />
paid <strong>in</strong>terest received, <strong>in</strong>terest capitalised, net foreign exchange ga<strong>in</strong>s and net fair value adjustments on <strong>in</strong>terest rate f<strong>in</strong>ancial <strong>in</strong>struments. See the group <strong>in</strong>come statement<br />
for an explanation of the computation of net f<strong>in</strong>ance costs. Special items cover those items which management believes are material by nature or amount to the operat<strong>in</strong>g<br />
results and require separate disclosure. Such items would generally <strong>in</strong>clude profit and loss on disposal of property, <strong>in</strong>vestments and bus<strong>in</strong>esses, asset impairments,<br />
restructur<strong>in</strong>g charges, non-recurr<strong>in</strong>g <strong>in</strong>tegration costs related to acquisitions, f<strong>in</strong>ancial impacts of natural disasters, non-cash ga<strong>in</strong>s or losses on the price fair value<br />
adjustment of plantations and alternative fuel tax credits receivable <strong>in</strong> cash.<br />
EBITDA, exclud<strong>in</strong>g special items represents operat<strong>in</strong>g profit before depreciation, amortisation and special items.<br />
We use both operat<strong>in</strong>g profit, exclud<strong>in</strong>g special items and EBITDA, exclud<strong>in</strong>g special items as <strong>in</strong>ternal measures of <strong>performance</strong> to benchmark and compare <strong>performance</strong>,<br />
both between our own operations and as aga<strong>in</strong>st other companies. Operat<strong>in</strong>g profit exclud<strong>in</strong>g special items and EBITDA, exclud<strong>in</strong>g special items are measures used by<br />
the group, together with measures of <strong>performance</strong> under IFRS, to compare the relative <strong>performance</strong> of operations <strong>in</strong> plann<strong>in</strong>g, budget<strong>in</strong>g and review<strong>in</strong>g the <strong>performance</strong>s<br />
of various bus<strong>in</strong>esses. We believe they are useful and commonly used measures of f<strong>in</strong>ancial <strong>performance</strong> <strong>in</strong> addition to net profit, operat<strong>in</strong>g profit and other profitability<br />
measures under IFRS because they facilitate operat<strong>in</strong>g <strong>performance</strong> comparisons from period to period and company to company. By elim<strong>in</strong>at<strong>in</strong>g potential differences<br />
<strong>in</strong> results of operations between periods or companies caused by factors such as depreciation and amortisation methods, historic cost and age of assets, f<strong>in</strong>anc<strong>in</strong>g and<br />
capital structures and taxation positions or regimes, we believe both operat<strong>in</strong>g profit, exclud<strong>in</strong>g special items and EBITDA, exclud<strong>in</strong>g special items can provide a useful<br />
additional basis for compar<strong>in</strong>g the current <strong>performance</strong> of the operations be<strong>in</strong>g evaluated. For these reasons, we believe operat<strong>in</strong>g profit exclud<strong>in</strong>g special items and<br />
EBITDA, exclud<strong>in</strong>g special items and similar measures are regularly used by the <strong>in</strong>vestment community as a means of comparison of companies <strong>in</strong> our <strong>in</strong>dustry. Different<br />
companies and analysts may calculate operat<strong>in</strong>g profit, exclud<strong>in</strong>g special items and EBITDA, exclud<strong>in</strong>g special items differently, so mak<strong>in</strong>g comparisons among companies<br />
on this basis should be done very carefully. Operat<strong>in</strong>g profit, exclud<strong>in</strong>g special items and EBITDA, exclud<strong>in</strong>g special items are not measures of <strong>performance</strong> under IFRS<br />
and should not be considered <strong>in</strong> isolation or construed as a substitute for operat<strong>in</strong>g profit or net profit as <strong>in</strong>dicators of the company’s operations <strong>in</strong> accordance with IFRS.<br />
(2) Net of treasury shares (refer note 17).<br />
(3) The dividends for all the f<strong>in</strong>ancial years were declared subsequent to year end.<br />
(4) Restated for the bonus element of the rights issue (refer note 7).<br />
* Special items cover those items which management believe are material by nature or amount to the operat<strong>in</strong>g results and require separate disclosure. Such items would<br />
generally <strong>in</strong>clude profit and loss on disposal of property, <strong>in</strong>vestments and bus<strong>in</strong>esses, asset impairments, restructur<strong>in</strong>g charges, non-recurr<strong>in</strong>g <strong>in</strong>tegration costs related<br />
to acquisitions, f<strong>in</strong>ancial impacts of natural disasters, non-cash ga<strong>in</strong>s or losses on the price fair value adjustment of plantations and alternative fuel tax credits receivable<br />
<strong>in</strong> cash.<br />
** The year ended September 2005 <strong>in</strong>cluded 53 weeks.<br />
our <strong>performance</strong>


