

Our performance in 2009 - Sappi
Our performance in 2009 - Sappi
Our performance in 2009 - Sappi

Create successful ePaper yourself
Turn your PDF publications into a flip-book with our unique Google optimized e-Paper software.
<strong>2009</strong> annual report 55<br />
Cash flow analysis<br />
In the table below we present the group’s cash flow statement <strong>in</strong> a summarised format:<br />
US$ million<br />
Cash generated by operations before post<br />
<strong>2009</strong> 2008<br />
employment benefits 494 711<br />
Contributions to post employment benefits (62) (88)<br />
Cash generated by operations 432 623<br />
Net movement <strong>in</strong> work<strong>in</strong>g capital 152 1<br />
Cash generated by operat<strong>in</strong>g activities 584 624<br />
Cash spent to ma<strong>in</strong>ta<strong>in</strong> and expand non-current assets* (176) (505)<br />
F<strong>in</strong>ance costs (81) (126)<br />
Taxation (5) (70)<br />
Other 4 11<br />
Dividends to shareholders (37) (73)<br />
Net cash generated (utilised) 289 (139)<br />
* <strong>2009</strong> excludes US$590 million relat<strong>in</strong>g to the acquisition and <strong>in</strong>cludes US$1 million of plantation expenditure.<br />
We generated cash from operations of US$432 million <strong>in</strong> <strong>2009</strong> compared to US$623 million <strong>in</strong><br />
2008. The significant decl<strong>in</strong>e <strong>in</strong> operat<strong>in</strong>g profit dur<strong>in</strong>g <strong>2009</strong> resulted <strong>in</strong> lower cash generated<br />
from operations when compared to 2008.<br />
Contributions to post employment benefits <strong>in</strong>clude approximately US$44 million <strong>in</strong> <strong>2009</strong> and<br />
US$38 million <strong>in</strong> 2008 of ‘catch-up’ payments to reduce fund<strong>in</strong>g deficits <strong>in</strong> certa<strong>in</strong> of our funds.<br />
We expect our total contributions <strong>in</strong> 2010 to be slightly above the <strong>2009</strong> levels.<br />
The US$152 million of cash released from work<strong>in</strong>g capital relates ma<strong>in</strong>ly to work<strong>in</strong>g capital<br />
reduction <strong>in</strong> the European bus<strong>in</strong>ess follow<strong>in</strong>g the acquisition as discussed <strong>in</strong> the section above.<br />
<strong>Our</strong> net cash generated for <strong>2009</strong> of US$289 million <strong>in</strong>cluded US$65 million of cash received for<br />
alternative fuel tax credits by our North American bus<strong>in</strong>ess and also an amount of US$55 million<br />
received when we unwound fixed-to-float<strong>in</strong>g <strong>in</strong>terest rate swaps as discussed above.<br />
<strong>Our</strong> <strong>in</strong>vestment <strong>in</strong> non-current assets was US$329 million lower than <strong>in</strong> 2008, due to the<br />
completion of the Saiccor Mill expansion and our drive to reduce capital expenditure dur<strong>in</strong>g the<br />
difficult market conditions we experienced dur<strong>in</strong>g the year.<br />
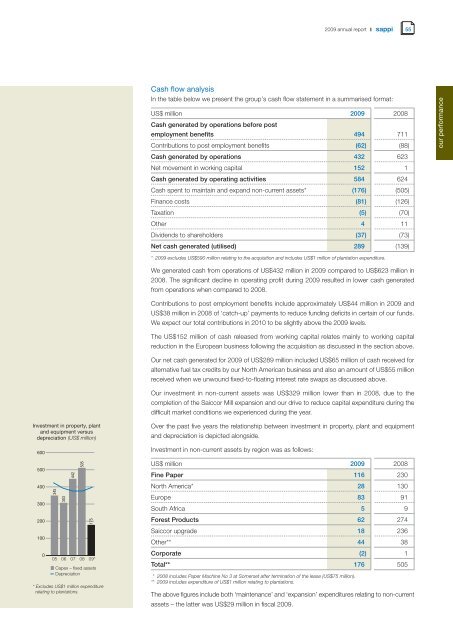
Over the past five years the relationship between <strong>in</strong>vestment <strong>in</strong> property, plant and equipment<br />
and depreciation is depicted alongside.<br />
Investment <strong>in</strong> non-current assets by region was as follows:<br />
US$ million <strong>2009</strong> 2008<br />
F<strong>in</strong>e Paper 116 230<br />
North America* 28 130<br />
Europe 83 91<br />
South Africa 5 9<br />
Forest Products 62 274<br />
Saiccor upgrade 18 236<br />
Other** 44 38<br />
Corporate (2) 1<br />
Total** 176 505<br />
* 2008 <strong>in</strong>cludes Paper Mach<strong>in</strong>e No 3 at Somerset after term<strong>in</strong>ation of the lease (US$75 million).<br />
** <strong>2009</strong> <strong>in</strong>cludes expenditure of US$1 million relat<strong>in</strong>g to plantations.<br />
The above figures <strong>in</strong>clude both ‘ma<strong>in</strong>tenance’ and ‘expansion’ expenditures relat<strong>in</strong>g to non-current<br />
assets – the latter was US$29 million <strong>in</strong> fiscal <strong>2009</strong>.<br />
our <strong>performance</strong>


