

Our performance in 2009 - Sappi
Our performance in 2009 - Sappi
Our performance in 2009 - Sappi

You also want an ePaper? Increase the reach of your titles
YUMPU automatically turns print PDFs into web optimized ePapers that Google loves.
40<br />
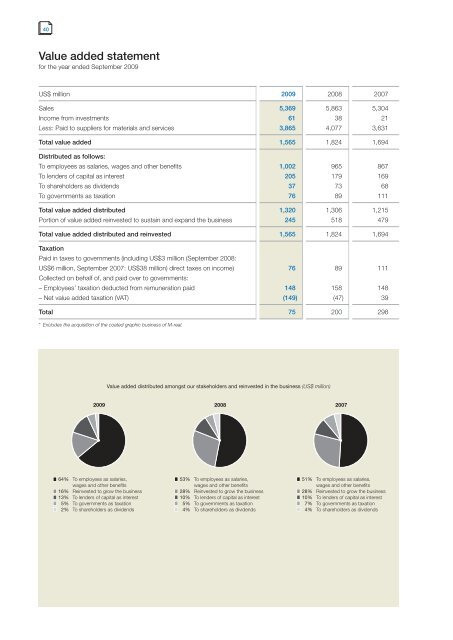
Value added statement<br />
for the year ended September <strong>2009</strong><br />
US$ million <strong>2009</strong> 2008 2007<br />
Sales 5,369 5,863 5,304<br />
Income from <strong>in</strong>vestments 61 38 21<br />
Less: Paid to suppliers for materials and services 3,865 4,077 3,631<br />
Total value added 1,565 1,824 1,694<br />
Distributed as follows:<br />
To employees as salaries, wages and other benefits 1,002 965 867<br />
To lenders of capital as <strong>in</strong>terest 205 179 169<br />
To shareholders as dividends 37 73 68<br />
To governments as taxation 76 89 111<br />
Total value added distributed 1,320 1,306 1,215<br />
Portion of value added re<strong>in</strong>vested to susta<strong>in</strong> and expand the bus<strong>in</strong>ess 245 518 479<br />
Total value added distributed and re<strong>in</strong>vested 1,565 1,824 1,694<br />
Taxation<br />
Paid <strong>in</strong> taxes to governments (<strong>in</strong>clud<strong>in</strong>g US$3 million (September 2008:<br />
US$6 million, September 2007: US$38 million) direct taxes on <strong>in</strong>come)<br />
Collected on behalf of, and paid over to governments:<br />
76 89 111<br />
– Employees’ taxation deducted from remuneration paid 148 158 148<br />
– Net value added taxation (VAT) (149) (47) 39<br />
Total 75 200 298<br />
* Excludes the acquisition of the coated graphic bus<strong>in</strong>ess of M-real.


