

Our performance in 2009 - Sappi
Our performance in 2009 - Sappi
Our performance in 2009 - Sappi

Create successful ePaper yourself
Turn your PDF publications into a flip-book with our unique Google optimized e-Paper software.
<strong>Our</strong> <strong>in</strong>come statement<br />
<strong>Our</strong> group f<strong>in</strong>ancial results can be summarised as follows:<br />
<strong>2009</strong> annual report 49<br />
<strong>2009</strong> % Change 2008<br />
Sales volume (metric tons ’000) 6,707 (2) 6,851<br />
US$ million US$ million<br />
Sales revenue 5,369 (8) 5,863<br />
Variable manufactur<strong>in</strong>g and delivery costs (3,322) (7) (3,582)<br />
Contribution 2,047 2,281<br />
Fixed costs (1,970) 5 (1,919)<br />
Sundry (loss) <strong>in</strong>come* (44) 4<br />
Operat<strong>in</strong>g profit exclud<strong>in</strong>g special items 33 (91) 366<br />
Special items (106) (52)<br />
Operat<strong>in</strong>g (loss) profit (73) 314<br />
F<strong>in</strong>ance costs (145) 15 (126)<br />
(Loss) profit before tax (218) 188<br />
Taxation 41 (86)<br />
Net (loss) profit<br />
Basic (loss) earn<strong>in</strong>gs per share<br />
(177) 102<br />
(US cents) (37) 28<br />
* Sundry (loss) <strong>in</strong>come consists ma<strong>in</strong>ly of <strong>in</strong>ventory revaluation, plantation fair value volume adjustments and external debtors<br />
securitisation costs.<br />
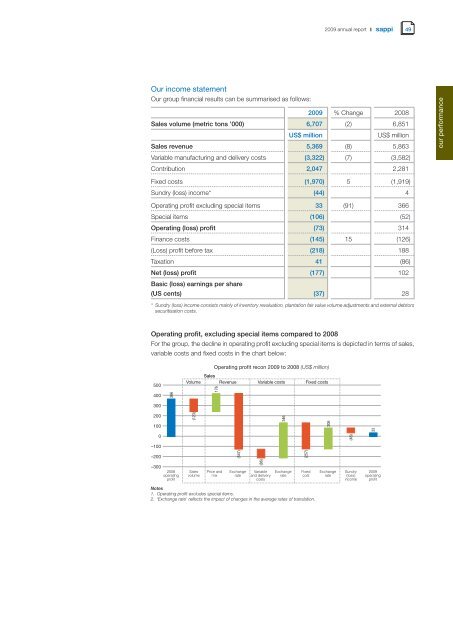
Operat<strong>in</strong>g profit, exclud<strong>in</strong>g special items compared to 2008<br />
For the group, the decl<strong>in</strong>e <strong>in</strong> operat<strong>in</strong>g profit exclud<strong>in</strong>g special items is depicted <strong>in</strong> terms of sales,<br />
variable costs and fixed costs <strong>in</strong> the chart below:<br />
our <strong>performance</strong>


