

Our performance in 2009 - Sappi
Our performance in 2009 - Sappi
Our performance in 2009 - Sappi

Create successful ePaper yourself
Turn your PDF publications into a flip-book with our unique Google optimized e-Paper software.
<strong>2009</strong> annual report<br />
<strong>2009</strong> 2008<br />
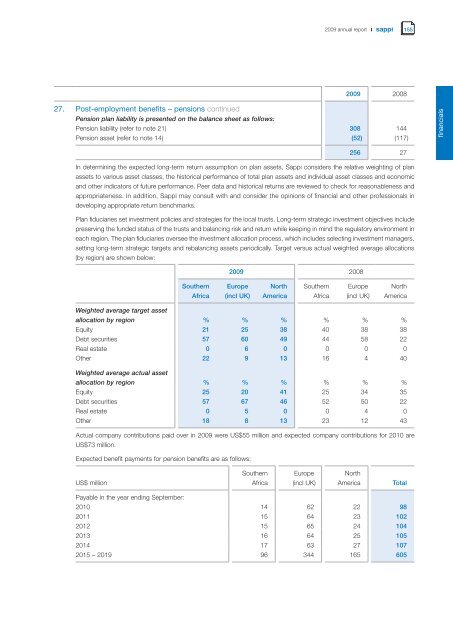
27. Post-employment benefits – pensions cont<strong>in</strong>ued<br />
Pension plan liability is presented on the balance sheet as follows:<br />
Pension liability (refer to note 21) 308 144<br />
Pension asset (refer to note 14) (52) (117)<br />
256 27<br />
In determ<strong>in</strong><strong>in</strong>g the expected long-term return assumption on plan assets, <strong>Sappi</strong> considers the relative weight<strong>in</strong>g of plan<br />
assets to various asset classes, the historical <strong>performance</strong> of total plan assets and <strong>in</strong>dividual asset classes and economic<br />
and other <strong>in</strong>dicators of future <strong>performance</strong>. Peer data and historical returns are reviewed to check for reasonableness and<br />
appropriateness. In addition, <strong>Sappi</strong> may consult with and consider the op<strong>in</strong>ions of f<strong>in</strong>ancial and other professionals <strong>in</strong><br />
develop<strong>in</strong>g appropriate return benchmarks.<br />
Plan fiduciaries set <strong>in</strong>vestment policies and strategies for the local trusts. Long-term strategic <strong>in</strong>vestment objectives <strong>in</strong>clude<br />
preserv<strong>in</strong>g the funded status of the trusts and balanc<strong>in</strong>g risk and return while keep<strong>in</strong>g <strong>in</strong> m<strong>in</strong>d the regulatory environment <strong>in</strong><br />
each region. The plan fiduciaries oversee the <strong>in</strong>vestment allocation process, which <strong>in</strong>cludes select<strong>in</strong>g <strong>in</strong>vestment managers,<br />
sett<strong>in</strong>g long-term strategic targets and rebalanc<strong>in</strong>g assets periodically. Target versus actual weighted average allocations<br />
(by region) are shown below:<br />
Southern<br />
Africa<br />
<strong>2009</strong> 2008<br />
Europe<br />
(<strong>in</strong>cl UK)<br />
North<br />
America<br />
Southern<br />
Africa<br />
Europe<br />
(<strong>in</strong>cl UK)<br />
155<br />
North<br />
America<br />
Weighted average target asset<br />
allocation by region % % % % % %<br />
Equity 21 25 38 40 38 38<br />
Debt securities 57 60 49 44 58 22<br />
Real estate 0 6 0 0 0 0<br />
Other 22 9 13 16 4 40<br />
Weighted average actual asset<br />
allocation by region % % % % % %<br />
Equity 25 20 41 25 34 35<br />
Debt securities 57 67 46 52 50 22<br />
Real estate 0 5 0 0 4 0<br />
Other 18 8 13 23 12 43<br />
Actual company contributions paid over <strong>in</strong> <strong>2009</strong> were US$55 million and expected company contributions for 2010 are<br />
US$73 million.<br />
Expected benefit payments for pension benefits are as follows:<br />
US$ million<br />
Southern<br />
Africa<br />
Europe<br />
(<strong>in</strong>cl UK)<br />
North<br />
America Total<br />
Payable <strong>in</strong> the year end<strong>in</strong>g September:<br />
2010 14 62 22 98<br />
2011 15 64 23 102<br />
2012 15 65 24 104<br />
2013 16 64 25 105<br />
2014 17 63 27 107<br />
2015 – 2019 96 344 165 605<br />
f<strong>in</strong>ancials


