

Our performance in 2009 - Sappi
Our performance in 2009 - Sappi
Our performance in 2009 - Sappi

Create successful ePaper yourself
Turn your PDF publications into a flip-book with our unique Google optimized e-Paper software.
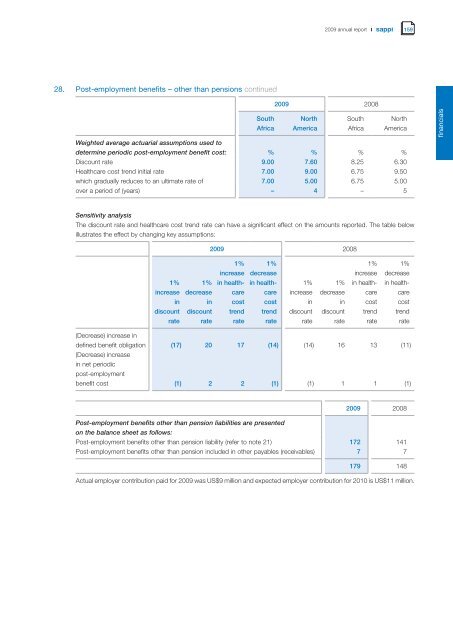
28. Post-employment benefits – other than pensions cont<strong>in</strong>ued<br />
South<br />
Africa<br />
<strong>2009</strong> annual report<br />
<strong>2009</strong> 2008<br />
North<br />
America<br />
South<br />
Africa<br />
North<br />
America<br />
Weighted average actuarial assumptions used to<br />
determ<strong>in</strong>e periodic post-employment benefit cost: % % % %<br />
Discount rate 9.00 7.60 8.25 6.30<br />
Healthcare cost trend <strong>in</strong>itial rate 7.00 9.00 6.75 9.50<br />
which gradually reduces to an ultimate rate of 7.00 5.00 6.75 5.00<br />
over a period of (years) – 4 – 5<br />
Sensitivity analysis<br />
The discount rate and healthcare cost trend rate can have a significant effect on the amounts reported. The table below<br />
illustrates the effect by chang<strong>in</strong>g key assumptions:<br />
1%<br />
<strong>in</strong>crease<br />
<strong>in</strong><br />
discount<br />
rate<br />
1%<br />
decrease<br />
<strong>in</strong><br />
discount<br />
rate<br />
<strong>2009</strong> 2008<br />
1%<br />
<strong>in</strong>crease<br />
<strong>in</strong> healthcare<br />
cost<br />
trend<br />
rate<br />
1%<br />
decrease<br />
<strong>in</strong> healthcare<br />
cost<br />
trend<br />
rate<br />
1%<br />
<strong>in</strong>crease<br />
<strong>in</strong><br />
discount<br />
rate<br />
1%<br />
decrease<br />
<strong>in</strong><br />
discount<br />
rate<br />
1%<br />
<strong>in</strong>crease<br />
<strong>in</strong> healthcare<br />
cost<br />
trend<br />
rate<br />
159<br />
1%<br />
decrease<br />
<strong>in</strong> healthcare<br />
cost<br />
trend<br />
rate<br />
(Decrease) <strong>in</strong>crease <strong>in</strong><br />
def<strong>in</strong>ed benefit obligation<br />
(Decrease) <strong>in</strong>crease<br />
<strong>in</strong> net periodic<br />
post-employment<br />
(17) 20 17 (14) (14) 16 13 (11)<br />
benefit cost (1) 2 2 (1) (1) 1 1 (1)<br />
<strong>2009</strong> 2008<br />
Post-employment benefits other than pension liabilities are presented<br />
on the balance sheet as follows:<br />
Post-employment benefits other than pension liability (refer to note 21) 172 141<br />
Post-employment benefits other than pension <strong>in</strong>cluded <strong>in</strong> other payables (receivables) 7 7<br />
179 148<br />
Actual employer contribution paid for <strong>2009</strong> was US$9 million and expected employer contribution for 2010 is US$11 million.<br />
f<strong>in</strong>ancials


