

Our performance in 2009 - Sappi
Our performance in 2009 - Sappi
Our performance in 2009 - Sappi

Create successful ePaper yourself
Turn your PDF publications into a flip-book with our unique Google optimized e-Paper software.
42 Chief f<strong>in</strong>ancial officer’s report cont<strong>in</strong>ued<br />
Operat<strong>in</strong>g <strong>performance</strong> of our divisions<br />
We believe that operat<strong>in</strong>g profit exclud<strong>in</strong>g special items is a good <strong>in</strong>dicator of underly<strong>in</strong>g<br />
operat<strong>in</strong>g <strong>performance</strong> as it excludes what management believes are items that are non-recurr<strong>in</strong>g<br />
and/or uncontrollable <strong>in</strong> the normal course. Please see page 52 further on for a full explanation<br />
of special items.<br />
Operat<strong>in</strong>g profit exclud<strong>in</strong>g special items decl<strong>in</strong>ed significantly compared to fiscal 2008 from<br />
US$366 million to US$33 million.<br />
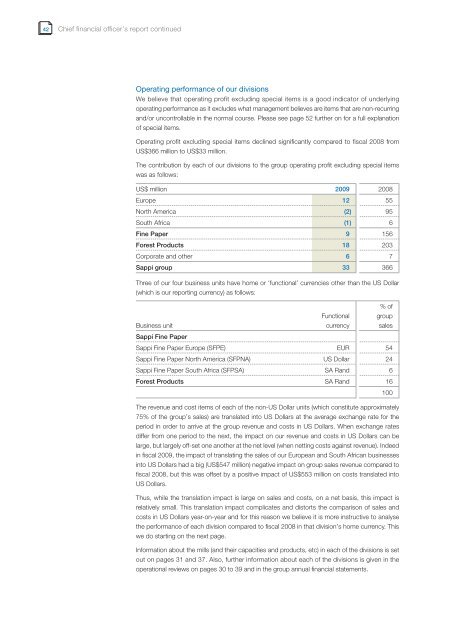
The contribution by each of our divisions to the group operat<strong>in</strong>g profit exclud<strong>in</strong>g special items<br />
was as follows:<br />
US$ million <strong>2009</strong> 2008<br />
Europe 12 55<br />
North America (2) 95<br />
South Africa (1) 6<br />
F<strong>in</strong>e Paper 9 156<br />
Forest Products 18 203<br />
Corporate and other 6 7<br />
<strong>Sappi</strong> group 33 366<br />
Three of our four bus<strong>in</strong>ess units have home or ‘functional’ currencies other than the US Dollar<br />
(which is our report<strong>in</strong>g currency) as follows:<br />
Functional<br />
% of<br />
group<br />
Bus<strong>in</strong>ess unit currency sales<br />
<strong>Sappi</strong> F<strong>in</strong>e Paper<br />
<strong>Sappi</strong> F<strong>in</strong>e Paper Europe (SFPE) EUR 54<br />
<strong>Sappi</strong> F<strong>in</strong>e Paper North America (SFPNA) US Dollar 24<br />
<strong>Sappi</strong> F<strong>in</strong>e Paper South Africa (SFPSA) SA Rand 6<br />
Forest Products SA Rand 16<br />
The revenue and cost items of each of the non-US Dollar units (which constitute approximately<br />
75% of the group’s sales) are translated <strong>in</strong>to US Dollars at the average exchange rate for the<br />
period <strong>in</strong> order to arrive at the group revenue and costs <strong>in</strong> US Dollars. When exchange rates<br />
differ from one period to the next, the impact on our revenue and costs <strong>in</strong> US Dollars can be<br />
large, but largely off-set one another at the net level (when nett<strong>in</strong>g costs aga<strong>in</strong>st revenue). Indeed<br />
<strong>in</strong> fiscal <strong>2009</strong>, the impact of translat<strong>in</strong>g the sales of our European and South African bus<strong>in</strong>esses<br />
<strong>in</strong>to US Dollars had a big (US$547 million) negative impact on group sales revenue compared to<br />
fiscal 2008, but this was offset by a positive impact of US$553 million on costs translated <strong>in</strong>to<br />
US Dollars.<br />
Thus, while the translation impact is large on sales and costs, on a net basis, this impact is<br />
relatively small. This translation impact complicates and distorts the comparison of sales and<br />
costs <strong>in</strong> US Dollars year-on-year and for this reason we believe it is more <strong>in</strong>structive to analyse<br />
the <strong>performance</strong> of each division compared to fiscal 2008 <strong>in</strong> that division’s home currency. This<br />
we do start<strong>in</strong>g on the next page.<br />
Information about the mills (and their capacities and products, etc) <strong>in</strong> each of the divisions is set<br />
out on pages 31 and 37. Also, further <strong>in</strong>formation about each of the divisions is given <strong>in</strong> the<br />
operational reviews on pages 30 to 39 and <strong>in</strong> the group annual f<strong>in</strong>ancial statements.<br />
100


