

Our performance in 2009 - Sappi
Our performance in 2009 - Sappi
Our performance in 2009 - Sappi

You also want an ePaper? Increase the reach of your titles
YUMPU automatically turns print PDFs into web optimized ePapers that Google loves.
118<br />
Notes to the group annual f<strong>in</strong>ancial statements cont<strong>in</strong>ued<br />
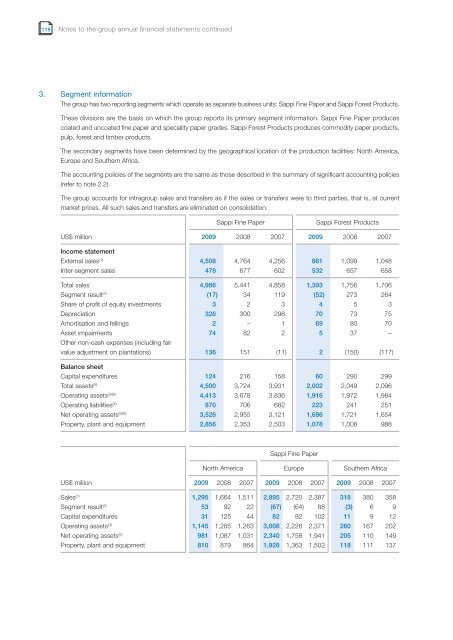
3. Segment <strong>in</strong>formation<br />
The group has two report<strong>in</strong>g segments which operate as separate bus<strong>in</strong>ess units: <strong>Sappi</strong> F<strong>in</strong>e Paper and <strong>Sappi</strong> Forest Products.<br />
These divisions are the basis on which the group reports its primary segment <strong>in</strong>formation. <strong>Sappi</strong> F<strong>in</strong>e Paper produces<br />
coated and uncoated f<strong>in</strong>e paper and speciality paper grades. <strong>Sappi</strong> Forest Products produces commodity paper products,<br />
pulp, forest and timber products.<br />
The secondary segments have been determ<strong>in</strong>ed by the geographical location of the production facilities: North America,<br />
Europe and Southern Africa.<br />
The account<strong>in</strong>g policies of the segments are the same as those described <strong>in</strong> the summary of significant account<strong>in</strong>g policies<br />
(refer to note 2.2).<br />
The group accounts for <strong>in</strong>tragroup sales and transfers as if the sales or transfers were to third parties, that is, at current<br />
market prices. All such sales and transfers are elim<strong>in</strong>ated on consolidation.<br />
US$ million<br />
<strong>Sappi</strong> F<strong>in</strong>e Paper <strong>Sappi</strong> Forest Products<br />
<strong>2009</strong> 2008 2007 <strong>2009</strong> 2008 2007<br />
Income statement<br />
External sales (1) 4,508 4,764 4,256 861 1,099 1,048<br />
Inter-segment sales 478 677 602 532 657 658<br />
Total sales 4,986 5,441 4,858 1,393 1,756 1,706<br />
Segment result (2) (17) 34 119 (52) 273 264<br />
Share of profit of equity <strong>in</strong>vestments 3 2 3 4 5 3<br />
Depreciation 326 300 298 70 73 75<br />
Amortisation and fell<strong>in</strong>gs 2 – 1 69 80 70<br />
Asset impairments<br />
Other non-cash expenses (<strong>in</strong>clud<strong>in</strong>g fair<br />
74 82 2 5 37 –<br />
value adjustment on plantations) 136 151 (11) 2 (150) (117)<br />
Balance sheet<br />
Capital expenditures 124 216 158 60 290 299<br />
Total assets (6) 4,500 3,724 3,931 2,002 2,049 2,096<br />
Operat<strong>in</strong>g assets (3)(6) 4,413 3,678 3,836 1,916 1,972 1,984<br />
Operat<strong>in</strong>g liabilities (4) 870 706 682 223 241 251<br />
Net operat<strong>in</strong>g assets (5)(6) 3,526 2,955 3,121 1,686 1,721 1,654<br />
Property, plant and equipment 2,856 2,353 2,503 1,078 1,008 988<br />
US$ million<br />
<strong>Sappi</strong> F<strong>in</strong>e Paper<br />
North America Europe Southern Africa<br />
<strong>2009</strong> 2008 2007 <strong>2009</strong> 2008 2007 <strong>2009</strong> 2008 2007<br />
Sales (1) 1,295 1,664 1,511 2,895 2,720 2,387 318 380 358<br />
Segment result (2) 53 92 22 (67) (64) 88 (3) 6 9<br />
Capital expenditures 31 125 44 82 82 102 11 9 12<br />
Operat<strong>in</strong>g assets (3) 1,145 1,285 1,263 3,008 2,226 2,371 260 167 202<br />
Net operat<strong>in</strong>g assets (5) 981 1,087 1,031 2,340 1,758 1,941 205 110 149<br />
Property, plant and equipment 810 879 864 1,928 1,363 1,502 118 111 137


