

Our performance in 2009 - Sappi
Our performance in 2009 - Sappi
Our performance in 2009 - Sappi

Create successful ePaper yourself
Turn your PDF publications into a flip-book with our unique Google optimized e-Paper software.
132<br />
US$ million<br />
Notes to the group annual f<strong>in</strong>ancial statements cont<strong>in</strong>ued<br />
Goodwill<br />
Licence<br />
<strong>2009</strong> 2008<br />
fees Patents Brands Total Goodwill<br />
Licence<br />
fees Patents Brands Total<br />
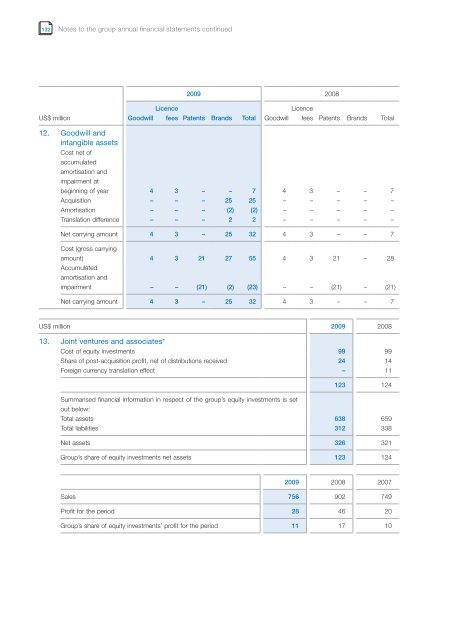
12. Goodwill and<br />
<strong>in</strong>tangible assets<br />
Cost net of<br />
accumulated<br />
amortisation and<br />
impairment at<br />
beg<strong>in</strong>n<strong>in</strong>g of year 4 3 – – 7 4 3 – – 7<br />
Acquisition – – – 25 25 – – – – –<br />
Amortisation – – – (2) (2) – – – – –<br />
Translation difference – – – 2 2 – – – – –<br />
Net carry<strong>in</strong>g amount 4 3 – 25 32 4 3 – – 7<br />
Cost (gross carry<strong>in</strong>g<br />
amount)<br />
Accumulated<br />
amortisation and<br />
4 3 21 27 55 4 3 21 – 28<br />
impairment – – (21) (2) (23) – – (21) – (21)<br />
Net carry<strong>in</strong>g amount 4 3 – 25 32 4 3 – – 7<br />
US$ million <strong>2009</strong> 2008<br />
13. Jo<strong>in</strong>t ventures and associates*<br />
Cost of equity <strong>in</strong>vestments 99 99<br />
Share of post-acquisition profit, net of distributions received 24 14<br />
Foreign currency translation effect – 11<br />
123 124<br />
Summarised f<strong>in</strong>ancial <strong>in</strong>formation <strong>in</strong> respect of the group’s equity <strong>in</strong>vestments is set<br />
out below:<br />
Total assets 638 659<br />
Total liabilities 312 338<br />
Net assets 326 321<br />
Group’s share of equity <strong>in</strong>vestments net assets 123 124<br />
<strong>2009</strong> 2008 2007<br />
Sales 756 902 749<br />
Profit for the period 28 46 20<br />
Group’s share of equity <strong>in</strong>vestments’ profit for the period 11 17 10


