- Page 1 and 2:
MANAGING TRAVEL FORPLANNED SPECIAL
- Page 3:
Technical Report Documentation Page
- Page 6 and 7:
TABLE OF CONTENTSINTRODUCTION......
- Page 8 and 9:
Available Resources ...............
- Page 10 and 11:
Stakeholder Roles and Coordination
- Page 12 and 13:
APPENDIX L - PUBLIC AGENCY AND EVEN
- Page 14 and 15:
Table 3-30 Crash Prevention Tactics
- Page 16 and 17:
Table 8-4 Day-of-Event Personnel Re
- Page 18 and 19:
LIST OF FIGURESFigure i-1 Planned S
- Page 20 and 21:
Figure 6-58 Portable Lighting .....
- Page 22 and 23:
BACKGROUNDPlanned special events po
- Page 24 and 25:
includes forming multidisciplinary
- Page 26 and 27:
THIS PAGE LEFT BLANKi-6
- Page 28 and 29:
congestion is considered either rec
- Page 30 and 31:
GOALS OF MANAGINGTRAVEL FOR PLANNED
- Page 32 and 33: Public agencies can enhance the ima
- Page 34 and 35: • 73 percent of surveyed metropol
- Page 36 and 37: Table 1-8Planned Special Event Mana
- Page 38 and 39: SPECIAL EVENTMANAGEMENTPHASEProgram
- Page 40 and 41: Board, Washington, D.C., January12
- Page 42 and 43: characteristics and how these chara
- Page 44 and 45: a spur-of-the-moment decision to at
- Page 46 and 47: Discrete/Recurring Event at a Perma
- Page 48 and 49: Arrowhead PondRed Wings vs. Mighty
- Page 50 and 51: TRAVELDEMANDROAD/SITECAPACITYAVAILA
- Page 52 and 53: transportation impact criteria: (1)
- Page 54 and 55: Figure 2-6Wisconsin TIME program Sp
- Page 56 and 57: INTEGRATIONOversightTeamEvent Plann
- Page 58 and 59: THIS PAGE LEFT BLANK2-18
- Page 60 and 61: developing and implementing solutio
- Page 62 and 63: Stakeholder Roles andCoordinationTh
- Page 64 and 65: A local or county department of pub
- Page 66 and 67: management strategies. For example,
- Page 68 and 69: modate planned special events. This
- Page 70 and 71: events. In turn, post-event activit
- Page 72 and 73: at the beginning of the event opera
- Page 74 and 75: • Notice of event for affected pr
- Page 76 and 77: • Links between process steps are
- Page 78 and 79: the event operations planning phase
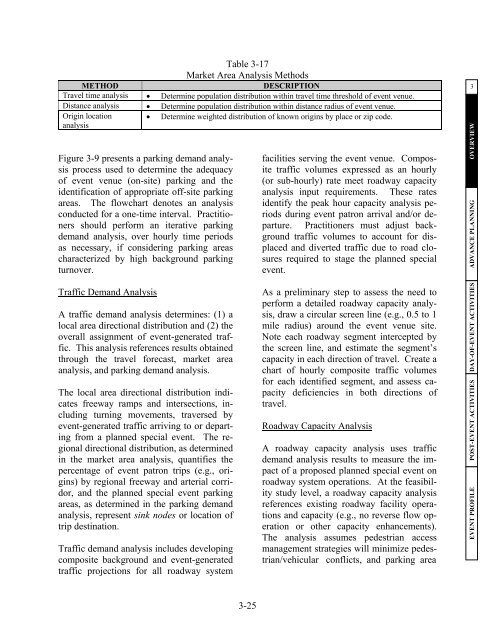
- Page 80 and 81: Table 3-14 summarizes four types of
- Page 84 and 85: Identify On-SiteParking Area(s)Park
- Page 86 and 87: Table 3-18Tools for Mitigating Plan
- Page 88 and 89: pick-up/drop-off area, during ingre
- Page 90 and 91: ELEMENTEvent patronparking areasTab
- Page 92 and 93: (2) provide a defined passenger wai
- Page 94 and 95: Table 3-25Tactics for Accommodating
- Page 96 and 97: and/or downstream lane closures tha
- Page 98 and 99: The key to maximizing capacity invo
- Page 100 and 101: or variable message signs. CMSs are
- Page 102 and 103: tion reports from various remote lo
- Page 104 and 105: Transit ServiceModifications to exi
- Page 106 and 107: ELEMENTCommand postoperationOperati
- Page 108 and 109: fail. Both the tabletop and full-sc
- Page 110 and 111: tion to performance evaluation data
- Page 112 and 113: Table 3-39Communications Structure
- Page 114 and 115: of a detailed evaluation report. Qu
- Page 116 and 117: Sample questions for possible inclu
- Page 118 and 119: THIS PAGE LEFT BLANK3-60
- Page 120 and 121: tions or a single municipality, res
- Page 123 and 124: events and annual fairs, or major e
- Page 125 and 126: sidered the resources. These resour
- Page 127 and 128: • Identification of funding sourc
- Page 129 and 130: PHASEProgramPlanningEventOperations
- Page 131 and 132: permit when the event organizer mee
- Page 133 and 134:
Table 4-4Planned Special Event Perm
- Page 135 and 136:
LOCATIONAnaheim, CAMenlo Park,CAMin
- Page 137 and 138:
egion. Appendix A contains Washingt
- Page 139 and 140:
Table 4-8 (cont’d.)Planned Specia
- Page 141 and 142:
Table 4-9 (cont’d.)Planned Specia
- Page 143 and 144:
Table 4-12Planned Special Event Per
- Page 145 and 146:
Table 4-15Planned Special Event Tec
- Page 147 and 148:
ITEM FUNCTIONS DEPLOYMENT APPLICATI
- Page 149 and 150:
clude: (1) remote modification of t
- Page 151 and 152:
agement. Not all of these are a sin
- Page 153 and 154:
9. Descriptions of tiers from mater
- Page 155 and 156:
CHAPTER FIVEEVENT OPERATIONS PLANNI
- Page 157 and 158:
work and schedule. The framework in
- Page 159 and 160:
Interagency CoordinationIn establis
- Page 161 and 162:
Fan CelebrationAnother severe impac
- Page 163 and 164:
process when forecasted traffic dem
- Page 165 and 166:
new and different stadium user with
- Page 167 and 168:
• The City also makes available g
- Page 169 and 170:
Table 5-8 summarizes four types of
- Page 171 and 172:
STEP SIXMITIGATION OF IMPACTSTraffi
- Page 173 and 174:
Table 5-11Feasibility Study Data Re
- Page 175 and 176:
Table 5-12Example Modal Split for D
- Page 177 and 178:
Table 5-14Example Planned Special E
- Page 179 and 180:
not offer advance ticket sales typi
- Page 181 and 182:
Parking Demand AnalysisA parking de
- Page 183 and 184:
Figure 5-11Designated Event Off-Sit
- Page 185 and 186:
• The first approach pertains to
- Page 187 and 188:
detail impact mitigation strategies
- Page 189 and 190:
5OVERVIEWFigure 5-16Site and Pedest
- Page 191 and 192:
Table 5-19External Factors Consider
- Page 193 and 194:
CHAPTER SIXTRAFFIC MANAGEMENT PLAN6
- Page 195 and 196:
• Express service (e.g., new rout
- Page 197 and 198:
6DAY-OF-EVENT ACTIVITIES ADVANCE PL
- Page 199 and 200:
VENUEPickup /Drop-offWalkSITE AREAR
- Page 201 and 202:
special events. This checklist incl
- Page 203 and 204:
alternatives may exist, each will n
- Page 205 and 206:
Lot AssignmentThe objectives of lot
- Page 207 and 208:
parking garage. The lack of such pe
- Page 209 and 210:
Table 6-7Key Findings from Saint Pa
- Page 211 and 212:
tern of ingress and egress to achie
- Page 213 and 214:
Any planned special event parking a
- Page 215 and 216:
• Park vehicles at the same rate
- Page 217 and 218:
lot(s) conflicts with heavy adjacen
- Page 219 and 220:
Figure 6-16Annotated Aerial Map of
- Page 221 and 222:
trols for pedestrian protection and
- Page 223 and 224:
Use of a temporary pedestrian bridg
- Page 225 and 226:
ordinate with the event planning te
- Page 227 and 228:
ManagementFigure 6-28On-Site Shuttl
- Page 229 and 230:
the impact to neighborhoods surroun
- Page 231 and 232:
• On the day-of-event, the manage
- Page 233 and 234:
An alternate route plan represents
- Page 235 and 236:
Figure 6-33Background Traffic Diver
- Page 237 and 238:
Arterial-to-Arterial DiversionArter
- Page 239 and 240:
modation tactic that the traffic ma
- Page 241 and 242:
Transportation system management ty
- Page 243 and 244:
prove interchange capacity and oper
- Page 245 and 246:
6OVERVIEWFigure 6-39Temporary Elimi
- Page 247 and 248:
efore they enter an alternative lan
- Page 249 and 250:
Table 6-36Portable Traffic Manageme
- Page 251 and 252:
Advance traffic signal operations p
- Page 253 and 254:
EN-ROUTE TRAVELERINFORMATION PLANOv
- Page 255 and 256:
or venue access route. These are te
- Page 257 and 258:
forces affect the signal, such as w
- Page 259 and 260:
now be accessed en-route via cellul
- Page 261 and 262:
Subscription ServicesA number of pr
- Page 263 and 264:
• Wireless communications (It sho
- Page 265 and 266:
unlit freeway interchanges or arter
- Page 267 and 268:
Traffic Incident Quick ClearanceIni
- Page 269 and 270:
16. Dudek, C.L., Guidelines forChan
- Page 271 and 272:
CHAPTER SEVENTRAVEL DEMAND MANAGEME
- Page 273 and 274:
Demand Management StrategiesSuccess
- Page 275 and 276:
Figure 7-2High Occupancy Vehicle In
- Page 277 and 278:
fore. The website suggested that ev
- Page 279 and 280:
during the games. The predominant c
- Page 281 and 282:
• Patronage Potential - The speci
- Page 283 and 284:
may exceed an hour. Patrons who use
- Page 285 and 286:
• Recommended event ingress and e
- Page 287 and 288:
planned special event impacts opera
- Page 289 and 290:
planned special event and related t
- Page 291 and 292:
Appendix M contains an example of a
- Page 293 and 294:
CHAPTER EIGHTIMPLEMENTATION ACTIVIT
- Page 295 and 296:
The implementation plan communicate
- Page 297 and 298:
ELEMENTLocationspecifictrafficand p
- Page 299 and 300:
ers be used to: (1) watch what happ
- Page 301 and 302:
Communication from the TMC to vario
- Page 303 and 304:
Volunteer RecruitmentPrior to initi
- Page 305 and 306:
CHAPTER NINEDAY-OF-EVENT ACTIVITIES
- Page 307 and 308:
stakeholders comprising the traffic
- Page 309 and 310:
operations planning phase, the ICS
- Page 311 and 312:
Table 9-3Traffic Management PlanEva
- Page 313 and 314:
formation to a dispatcher who, in t
- Page 315 and 316:
seek out other sources. The media m
- Page 317 and 318:
Traffic Management SupportIn a traf
- Page 319 and 320:
Table 9-13Performance Evaluation Me
- Page 321 and 322:
CHAPTER TENPOST-EVENT ACTIVITIES10O
- Page 323 and 324:
Table 10-1Key Post-Event Activities
- Page 325 and 326:
ing events, slight changes in circu
- Page 327 and 328:
inaccurate, it will become clear th
- Page 329 and 330:
ics of interest to all participants
- Page 331 and 332:
spectives are noted during the debr
- Page 333 and 334:
CHAPTER ELEVENDISCRETE/RECURRING EV
- Page 335 and 336:
peak pedestrian and traffic departu
- Page 337 and 338:
STEPNO. PAGE1 5-202 7-93 5-214 5-22
- Page 339 and 340:
sive express bus service between ar
- Page 341 and 342:
POST-EVENTACTIVITIESSince a discret
- Page 343 and 344:
market an express bus service for a
- Page 345 and 346:
CHAPTER TWELVECONTINUOUS EVENT12OVE
- Page 347 and 348:
EVENT OPERATIONSPLANNINGBecause of
- Page 349 and 350:
NO.STEPPAGE1 5-202 7-93 5-214 5-225
- Page 351 and 352:
Table 12-4Checklist of Implementati
- Page 353 and 354:
Some distinguishing considerations
- Page 355 and 356:
CHAPTER THIRTEENSTREET USE EVENT13O
- Page 357 and 358:
EVENT OPERATIONSPLANNINGSince stree
- Page 359 and 360:
STEPNO. PAGE1 5-202 7-93 5-214 5-22
- Page 361 and 362:
may not regularly take place in the
- Page 363 and 364:
HANDBOOKPAGETable 13-5Checklist of
- Page 365 and 366:
• A planned special event permit
- Page 367 and 368:
CHAPTER FOURTEENREGIONAL/MULTI-VENU
- Page 369 and 370:
several vantage points (e.g., parks
- Page 371 and 372:
Table 14-3Event Operations Planning
- Page 373 and 374:
Table 14-4 presents a checklist ofi
- Page 375 and 376:
• With regard to regional/multi-v
- Page 377 and 378:
CHAPTER FIFTEENRURAL EVENT15OVERVIE
- Page 379 and 380:
ies by event, as some rural events
- Page 381 and 382:
STEPNO. PAGETable 15-3Event Operati
- Page 383 and 384:
Table 15-4Checklist of Implementati
- Page 385 and 386:
Some distinguishing considerations
- Page 387 and 388:
should focus on equipment and techn
- Page 389 and 390:
APPENDIX ASAMPLE SPECIAL EVENT PERM
- Page 391 and 392:
VIRGINIA BEACH, VA: PERMIT APPLICAT
- Page 393 and 394:
A-5
- Page 395 and 396:
EVANSTON, IL: SPECIAL EVENT HOLD HA
- Page 397 and 398:
MONTGOMERY COUNTY, MD: SPECIAL EVEN
- Page 399 and 400:
A-11
- Page 401 and 402:
APPENDIX BEVENT-ORIENTED RISK SCENA
- Page 403 and 404:
APPENDIX CINTERAGENCY AGREEMENTS FO
- Page 405 and 406:
APPENDIX D2003 FAIR SAINT LOUIS EVE
- Page 407 and 408:
APPENDIX FPARKING AND PEDESTRIAN AC
- Page 409 and 410:
APPENDIX GWISCONSIN DOT ORGANIZATIO
- Page 411 and 412:
G-3
- Page 413 and 414:
BRISTOL (TN) MOTOR SPEEDWAYSource:
- Page 415 and 416:
PALACE OF AUBURN HILLS (MI)PARKING
- Page 417 and 418:
TALLADEGA (AL) SUPERSPEEDWAYNote:
- Page 419 and 420:
NASCAR DAYTONA 500Source: www.dayto
- Page 421 and 422:
MICHIGAN INTERNATIONAL SPEEDWAYSour
- Page 423 and 424:
MARTINSVILLE (VA) SPEEDWAYSource: w
- Page 425 and 426:
APPENDIX KEXAMPLE TRAFFIC CONTROL P
- Page 427 and 428:
FREEWAY SIGNING PLANNASCAR BRICKYAR
- Page 429 and 430:
EQUIPMENT LOCATION PLANSYDNEY, AUST
- Page 431 and 432:
Source: www.ci.daytona-beach.fl.us/
- Page 433 and 434:
SEATTLE CENTERSEATTLE, WASource: ww
- Page 435 and 436:
RICHMOND INTERNATIONAL RACEWAYRICHM
- Page 437 and 438:
PNC PARKPITTSBURGH, PASource: pirat
- Page 439 and 440:
M-2
- Page 441 and 442:
FORD FIELDDETROIT, MIM-4
- Page 443 and 444:
APPENDIX NSAMPLE IMPLEMENTATION PLA
- Page 445 and 446:
N-3
- Page 447 and 448:
N-5