- Page 2 and 3:
© Commonwealth of Australia 2007IS
- Page 5 and 6:
ForewordIn 2003, when heads of Aust
- Page 7 and 8:
ContentsForewordContentsAcronyms an
- Page 9 and 10:
7.4 Juvenile diversions as a propor
- Page 11 and 12:
Acronyms and abbreviationsABSACDPAC
- Page 13 and 14:
LSAYLSICMCATSIAMCEETYAMOUNATSISNATS
- Page 15 and 16:
GlossaryAboriginalAge standardisedr
- Page 17 and 18:
ICDEquivalisedhousehold incomeIncom
- Page 19 and 20:
For example, the gross monthly inco
- Page 21 and 22:
StatisticalsignificanceStatistical
- Page 23 and 24:
In May 1997, I wrote to your predec
- Page 25 and 26:
situations of Aboriginal people and
- Page 27 and 28:
Other health outcomes deteriorated.
- Page 29 and 30:
• Indigenous owned or controlled
- Page 31 and 32:
Governments and Indigenous people h
- Page 33 and 34:
• on-going government support (in
- Page 35 and 36:
Source: ABS (2004b); table 3A.1.1.D
- Page 37 and 38:
Apparent retention rates of full ti
- Page 39 and 40:
The labour force participation rate
- Page 41 and 42:
Home ownership is an important econ
- Page 43 and 44:
Substantiated child abuse and negle
- Page 45 and 46:
Box 1.16KEY MESSAGES• Comparable
- Page 47 and 48:
Age standardised adult imprisonment
- Page 49 and 50:
Strategic areas for actionFunctiona
- Page 51 and 52:
Box 1.21Things that work• The Jab
- Page 53 and 54:
Box 1.25Things that work• Congres
- Page 55 and 56:
Box 1.28KEY MESSAGES• Data on too
- Page 57 and 58:
elationship between the number of d
- Page 59 and 60:
uilt upon, or interventions can ass
- Page 61 and 62:
Box 1.37KEY MESSAGES• In 2006, 8
- Page 63 and 64:
Box 1.41Things that work• The Cir
- Page 65 and 66:
Alcohol consumption at long term ri
- Page 67 and 68:
Box 1.47• In 2004-05:KEY MESSAGES
- Page 69 and 70:
Prisoners, by known prior adult imp
- Page 71 and 72:
Box 1.54Things that work• The Mar
- Page 73 and 74:
ceremonies, rituals and history. So
- Page 75 and 76:
Communication with service provider
- Page 77 and 78:
Hospitalisation rates for Indigenou
- Page 79 and 80:
Indigenous people 15 years and over
- Page 81 and 82:
Box 1.67Things that work• The Abo
- Page 83 and 84:
mining royalties and tourism), Indi
- Page 85 and 86:
Box 1.74KEY MESSAGES• Six determi
- Page 87 and 88:
Median (mid point) individual incom
- Page 89 and 90:
FUTURE DIRECTIONS IN DATANotwithsta
- Page 91 and 92:
1 IntroductionIn April 2002, the Co
- Page 93 and 94:
In order to provide a comprehensive
- Page 95 and 96:
Identify indicators that are of rel
- Page 97 and 98:
—— 2004-2007a, Report on Govern
- Page 99 and 100:
2 The frameworkThe first two sectio
- Page 101 and 102:
3. Strategic areas for actionGovern
- Page 103 and 104:
Headline indicatorsThe headline ind
- Page 105 and 106:
Figure 2.2.3 A preventive model —
- Page 107 and 108:
• Retention at year 9• Indigeno
- Page 109 and 110:
Similarly, the previous indicator
- Page 111 and 112:
In 2006, following publication of t
- Page 113 and 114:
Suggested cultural indicators were
- Page 115 and 116:
The ‘Economic participation and d
- Page 117 and 118:
• Survey data: surveys, such as t
- Page 119 and 120:
• 2004-05 National Health Survey
- Page 121 and 122:
—— 2004b, National Aboriginal a
- Page 123 and 124:
3 Headline indicatorsSafe, healthy
- Page 125 and 126:
specific death rates 1 ) continued
- Page 127 and 128:
while the life expectancy of Indige
- Page 129 and 130:
Table 3.1.2Age specific death rates
- Page 131 and 132:
• In the period 2001 to 2005, age
- Page 133 and 134:
Box 3.2.2‘Things that work’ - d
- Page 135 and 136:
In 2002, the proportion of Indigeno
- Page 137 and 138:
• Among older people (aged 55 yea
- Page 139 and 140:
people with at least one long-term
- Page 141 and 142:
Table 3.2.1Age standardised hospita
- Page 143 and 144:
wellbeing (and other positive healt
- Page 145 and 146:
Health and education are intimately
- Page 147 and 148:
Figure 3.3.2 Apparent retention rat
- Page 149 and 150:
Figure 3.3.4 Apparent retention rat
- Page 151 and 152:
• Nationally, the proportion of I
- Page 153 and 154:
• their health outcomes and their
- Page 155 and 156:
extent to which people over 18 year
- Page 157 and 158:
Post secondary attainmentOne measur
- Page 159 and 160:
• In 2005, the national load pass
- Page 161 and 162:
3.5 Labour force participation and
- Page 163 and 164:
communities where the labour market
- Page 165 and 166:
Figure 3.5.2 CDEP participation, In
- Page 167 and 168:
Table 3.5.1Labour force participati
- Page 169 and 170:
• Nationally, the labour force pa
- Page 171 and 172:
Figure 3.5.7 Unemployment rate of p
- Page 173 and 174:
Figure 3.5.9 Unemployment rate of p
- Page 175 and 176:
Figure 3.5.10 Long term unemploymen
- Page 177 and 178:
Chapter 12 of this Report discusses
- Page 179 and 180:
Box 3.6.2(continued)Median value is
- Page 181 and 182:
Figure 3.6.1 Median gross weekly eq
- Page 183 and 184:
the population into five equal grou
- Page 185 and 186:
Figure 3.6.5 Distribution of gross
- Page 187 and 188:
• Age-related patterns in income
- Page 189 and 190:
Box 3.7.2‘Things that work’ —
- Page 191 and 192:
easonably simple to derive and prov
- Page 193 and 194:
Figure 3.7.2 Proportion of Indigeno
- Page 195 and 196:
3.8 Suicide and self-harmBox 3.8.1K
- Page 197 and 198:
Box 3.8.2(continued)A study found t
- Page 199 and 200:
Figure 3.8.2 Intentional self-harm
- Page 201 and 202:
Figure 3.8.3 Average annual suicide
- Page 203 and 204:
• Analysis of data from the Top E
- Page 205 and 206:
healthy and supported by their fami
- Page 207 and 208:
Figure 3.9.1 Rate per 1000 children
- Page 209 and 210:
Figure 3.9.3 Children aged 0-16 yea
- Page 211 and 212:
Table 3.9.1Number of diagnoses of c
- Page 213 and 214:
Indigenous than non-Indigenous peop
- Page 215 and 216:
Figure 3.10.1 Homicide death rates,
- Page 217 and 218:
Figure 3.10.3 Average annual homici
- Page 219 and 220:
Table 3.10.1 Comparative statistics
- Page 221 and 222:
Patterns and trendsPatterns and tre
- Page 223 and 224:
Hospitalisations for assaultFigure
- Page 225 and 226:
The lack of a common definition mea
- Page 227 and 228:
Box 3.11.2 (continued)A key compone
- Page 229 and 230:
• Indigenous women reported highe
- Page 231 and 232:
Figure 3.11.2 SAAP support periods:
- Page 233 and 234:
New South WalesFigure 3.11.3 Victim
- Page 235 and 236:
VictoriaFigure 3.11.5 Victims recor
- Page 237 and 238:
non-Indigenous people (65.3 per cen
- Page 239 and 240:
Figure 3.11.7 Victim-offender relat
- Page 241 and 242:
Northern TerritoryTable 3.11.2 Vict
- Page 243 and 244:
murder the offender was ‘other’
- Page 245 and 246:
Box 3.12.2 (continued)Victoria’s
- Page 247 and 248:
People under 18 years are treated a
- Page 249 and 250:
Figure 3.12.1 Age standardised impr
- Page 251 and 252:
past five years, the rates of impri
- Page 253 and 254:
Juvenile detentionFigure 3.12.4 Juv
- Page 255 and 256:
• Nationally on 30 June 2005, the
- Page 257 and 258:
3.11 Family and community violenceT
- Page 259 and 260:
Table 3A.3.10Table 3A.3.11Table 3A.
- Page 261 and 262:
3.6 Household and individual income
- Page 263 and 264:
3.11 Family and community violenceT
- Page 265 and 266:
Table 3A.11.46Table 3A.11.47Table 3
- Page 267 and 268:
—— and AIHW (Australian Institu
- Page 269 and 270:
http://www.who.int/hpr/NPH/docs/ott
- Page 271 and 272:
Hunter, B. and Gray, M. 1999, Furth
- Page 273 and 274:
Swan, P. and Raphael, B. 1995, Ways
- Page 275 and 276:
—— 2005, Through Young Black Ey
- Page 277 and 278:
—— 2006, Population by Age and
- Page 279 and 280:
3.12 Imprisonment and juvenile dete
- Page 281 and 282:
4 Strategic areas for action4.1 The
- Page 283 and 284:
5 Early child development and growt
- Page 285 and 286:
cited in Couzos, Metcalf and Murray
- Page 287 and 288:
some Aboriginal communities are ass
- Page 289 and 290:
Box 5.1.2(continued)Growth Assessme
- Page 291 and 292:
preventable condition for which Ind
- Page 293 and 294:
Figure 5.1.2 Deaths from external c
- Page 295 and 296:
Box 5.2.2(continued)Between 1993-95
- Page 297 and 298:
Figure 5.2.2 Infant mortality, by I
- Page 299 and 300:
irth weight are compounded by high
- Page 301 and 302:
Box 5.3.2(continued)Strong Women, S
- Page 303 and 304:
Box 5.3.2(continued)The model was d
- Page 305 and 306:
abies had non-Indigenous mothers an
- Page 307 and 308:
5.4 Hearing impedimentsBox 5.4.1Key
- Page 309 and 310:
Box 5.4.2(continued)• Chronic oti
- Page 311 and 312:
Box 5.4.3‘Things that work’ —
- Page 313 and 314:
Figure 5.4.2 Prevalence of otitis m
- Page 315 and 316:
• Although the hospitalisation ra
- Page 317 and 318:
Box 5.5.2‘Things that work’ —
- Page 319 and 320:
Table 5.5.1Children’s mean number
- Page 321 and 322:
• The percentage of Indigenous ch
- Page 323 and 324:
difference in scores between Indige
- Page 325 and 326:
• According to the 2002 Child Den
- Page 327 and 328:
• A greater proportion of Indigen
- Page 329 and 330:
Figure 5.5.5 Hospital dental proced
- Page 331 and 332:
The proposed Longitudinal Study of
- Page 333 and 334:
5.8 References5 Early child develop
- Page 335 and 336:
Central Public Health Unit Network
- Page 337 and 338:
Mackerras D 1998, Evaluation of the
- Page 339 and 340:
Leach, A.J., Boswell, J.B., Asche,
- Page 341 and 342:
Harford, J., Spencer, J., Roberts-T
- Page 343 and 344:
6 Early school engagement andperfor
- Page 345 and 346:
2002). Gaps that appear in children
- Page 347 and 348:
Table 6.1.1Participation rates in p
- Page 349 and 350:
this approach was legal (DEWR 2006)
- Page 351 and 352:
• School participation rates are
- Page 353 and 354:
Box 6.3.2(continued)Scaffolding Lit
- Page 355 and 356:
Figure 6.3.2 Proportion of year 3 s
- Page 357 and 358:
Figure 6.3.4 Proportion of year 3 s
- Page 359 and 360:
Figure 6.3.6 Proportion of year 3 s
- Page 361 and 362:
6.3 Year 3 literacy and numeracyTab
- Page 363 and 364:
Table 6A.3.46Table 6A.3.47Table 6A.
- Page 365 and 366:
NTDE (Northern Territory Department
- Page 367 and 368:
Young People, Curtin University of
- Page 369 and 370:
7 Positive childhood and transition
- Page 371 and 372:
In most states and territories, com
- Page 373 and 374:
Attachment tablesAttachment tables
- Page 375 and 376:
Nationally comparable learning outc
- Page 377 and 378:
Year 5 writingFigure 7.1.3 Proporti
- Page 379 and 380:
Year 5 numeracyFigure 7.1.5 Proport
- Page 381 and 382:
Year 7 readingFigure 7.1.7 Proporti
- Page 383 and 384:
Year 7 writingFigure 7.1.9 Proporti
- Page 385 and 386:
Year 7 numeracyFigure 7.1.11 Propor
- Page 387 and 388:
then year 7 in 2005, and be tested
- Page 389 and 390:
Figure 7.1.15 Proportion of year 3
- Page 391 and 392:
non-Indigenous children, reducing t
- Page 393 and 394:
7.3 Indigenous cultural studies in
- Page 395 and 396:
Box 7.3.2Bendigo Senior Secondary C
- Page 397 and 398:
Box 7.3.6Western Arrernte Picture D
- Page 399 and 400:
Table 7.3.1 Indigenous employment i
- Page 401 and 402:
Box 7.3.8RATEP — a community base
- Page 403 and 404:
Box 7.4.2(continued)• Police and
- Page 405 and 406:
New South WalesTable 7.4.1NSW, numb
- Page 407 and 408:
pattern was observed for non-Indige
- Page 409 and 410:
Figure 7.4.2 WA, Indigenous and non
- Page 411 and 412:
Figure 7.4.3 SA, proportion of Indi
- Page 413 and 414:
7.5 Transition from school to workB
- Page 415 and 416:
(see section 7.2 Retention at year
- Page 417 and 418:
studying, for both Indigenous and n
- Page 419 and 420:
• Similar patterns to those in th
- Page 421 and 422:
7.6 Future directions in dataYears
- Page 423 and 424:
Table 7A.4.12Table 7A.4.13Victoria,
- Page 425 and 426:
Paper National Benchmark Results Re
- Page 427:
Randell, N. (ed.) 2002, Including t
- Page 430 and 431:
and important correlates of crimina
- Page 432 and 433:
8.1 Alcohol consumption and harmBox
- Page 434 and 435:
Patterns of alcohol consumptionThe
- Page 436 and 437:
Figure 8.1.1 Alcohol consumption at
- Page 438 and 439:
• For both Indigenous and non-Ind
- Page 440 and 441:
Table 8.1.3Alcohol consumption at s
- Page 442 and 443:
Figure 8.1.4 Alcohol involvement in
- Page 444 and 445:
disability and behaviour problems (
- Page 446 and 447:
• hospitalisation rates for all c
- Page 448 and 449:
Data on tobacco use in this section
- Page 450 and 451:
current daily smokers than non-Indi
- Page 452 and 453:
Figure 8.2.4 Mothers reporting smok
- Page 454 and 455:
8.3 Drug and other substance use an
- Page 456 and 457:
In 2004-05, among Indigenous adults
- Page 458 and 459:
interventions, there had been a red
- Page 460 and 461:
Drug related crimeBroadly speaking,
- Page 462 and 463:
Figure 8.3.2 Drug influenced Indige
- Page 464 and 465:
• develop an appropriate methodol
- Page 466 and 467:
Strait Islander Peoples 2005, ABS C
- Page 468 and 469:
AIHW (Australian Institute of Healt
- Page 470 and 471:
Makkai T. and Payne J. 2003, Drugs
- Page 472 and 473:
• income• suicide and self-harm
- Page 474 and 475:
Following consultations in 2006, a
- Page 476 and 477:
Attachment tablesAttachment tables
- Page 478 and 479:
An increased rate may also be due t
- Page 480 and 481:
Figure 9.1.1 Placement of Indigenou
- Page 482 and 483:
Box 9.2.2(continued)their local com
- Page 484 and 485:
Adult repeat offendingFigure 9.2.1
- Page 486 and 487:
• Nationally in 2006, 75.3 per ce
- Page 488 and 489:
69.0 per cent had been in prison pr
- Page 490 and 491:
juvenile justice system and 2 496 a
- Page 492 and 493:
juvenile justice system was dismiss
- Page 494 and 495:
chronic disease, early child develo
- Page 496 and 497:
Box 9.3.3‘Things that work’ —
- Page 498 and 499:
Table 9.3.1Expenditure on health ca
- Page 500 and 501:
Table 9.3.2Age standardised hospita
- Page 502 and 503:
presents hospitalisation rates for
- Page 504 and 505:
lower than those in 2001-02 for bot
- Page 506 and 507:
Figure 9.3.2 compares the length of
- Page 508 and 509:
non-remote areas were twice as like
- Page 510 and 511:
• A greater proportion of discret
- Page 512 and 513:
The following definitions of mental
- Page 514 and 515:
Box 9.4.2(continued)Aboriginal Ment
- Page 516 and 517:
• In 2004-05, 48.0 per cent of In
- Page 518 and 519:
• Life events or ‘stressors’
- Page 520 and 521:
• Over the period, the age-standa
- Page 522 and 523:
Table 9.4.2Indigenous standardised
- Page 524 and 525:
Death rates for mental and behaviou
- Page 526 and 527:
A WA study on prisoner health and m
- Page 528 and 529:
• The proportion of children at h
- Page 530 and 531:
Some Indigenous people living in ci
- Page 532 and 533:
Figure 9.5.3 Proportion of Indigeno
- Page 534 and 535:
were judged by their teachers to be
- Page 536 and 537:
Figure 9.6.2 Participation in exerc
- Page 538 and 539:
Box 9.6.3Little Yuin Aboriginal Pre
- Page 540 and 541:
Box 9.6.6Athletics Australia ‘Ath
- Page 542 and 543:
Box 9.6.8(continued)The Australian
- Page 544 and 545:
discrete Aboriginal and Torres Stra
- Page 546 and 547:
Figure 9.7.3 How Indigenous people
- Page 548 and 549:
Figure 9.7.5 Communication with ser
- Page 550 and 551:
Indigenous communities. 2 The 2006
- Page 552 and 553:
with the 1993 Western Australian Ch
- Page 554 and 555:
Box 9.7.3Health Education Unit —
- Page 556 and 557:
Box 9.7.5Interpreter accreditation
- Page 558 and 559:
Box 9.7.8Pre-hospital care in remot
- Page 560 and 561:
Participation in organised sport, a
- Page 562 and 563:
9.3 Access to primary health careTa
- Page 564 and 565:
age standardised, by remoteness are
- Page 566 and 567:
Table 9A.4.41Table 9A.4.42Table 9A.
- Page 568 and 569:
SHRG (Social Health Reference Group
- Page 570 and 571:
9.4 Mental healthABS (Australian Bu
- Page 572 and 573:
Procter, N. 2005, ‘Parasuicide, s
- Page 574 and 575:
Daly, A.E. 2001, Implications of De
- Page 576 and 577:
Menzies School of Health Research 2
- Page 578 and 579:
infrastructure as well as functioni
- Page 580 and 581:
some duplication, as patients can h
- Page 582 and 583:
After adjusting for age differences
- Page 584 and 585:
Figure 10.1.2 Age standardised hosp
- Page 586 and 587:
Figure 10.1.3 Hospitalisation rates
- Page 588 and 589:
Figure 10.1.4 Death rates from dise
- Page 590 and 591:
In rural and remote areas, there is
- Page 592 and 593: In June 2006, an estimated 510 000
- Page 594 and 595: Figure 10.2.2 Experienced water int
- Page 596 and 597: Types of sewerage systemsIn the 200
- Page 598 and 599: Access to cooking, washing and toil
- Page 600 and 601: The occupancy standard determines o
- Page 602 and 603: • There were no statistically sig
- Page 604 and 605: Figure 10.3.4 Proportion of Indigen
- Page 606 and 607: 10.2 Access to clean water and func
- Page 608 and 609: Pholeros P., Rainow S. and Torzillo
- Page 610 and 611: Indigenous owned land yields econom
- Page 612 and 613: Box 11.1.2 ‘Things that work’
- Page 614 and 615: Box 11.1.2 (continued)The success o
- Page 616 and 617: Employment by full time/part time s
- Page 618 and 619: Figure 11.1.3 Full time and part ti
- Page 620 and 621: Figure 11.1.5 Full time and part ti
- Page 622 and 623: Data on full time and part time emp
- Page 624 and 625: • CDEP participation accounted fo
- Page 626 and 627: people’s wellbeing (see section 1
- Page 628 and 629: Box 11.2.2 Walking Tourism Business
- Page 630 and 631: 11.3 Indigenous owned or controlled
- Page 632 and 633: The potential to derive economic be
- Page 634 and 635: • land-based investments for capi
- Page 636 and 637: Box 11.3.2 (continued)In 2006, fund
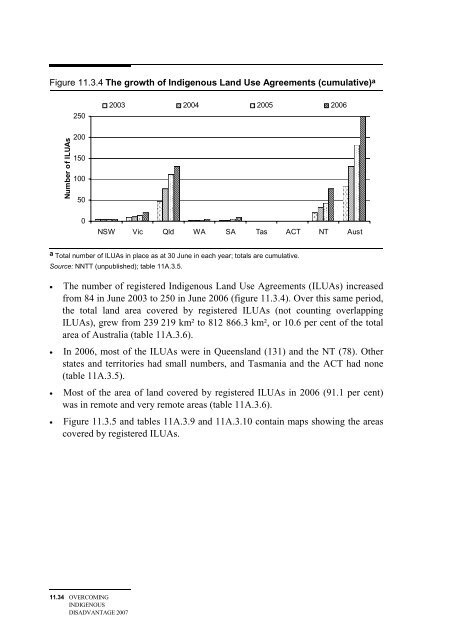
- Page 638 and 639: Indigenous Land Use AgreementsIndig
- Page 640 and 641: • Indigenous owned or controlled
- Page 644 and 645: and corporate behaviour, and descri
- Page 646 and 647: Box 11.4.2 ‘Things that work’
- Page 648 and 649: Figure 11.4.1 Proportion of univers
- Page 650 and 651: while the proportion of non-Indigen
- Page 652 and 653: State and Territory data on the num
- Page 654 and 655: areas of agreement, ‘governments
- Page 656 and 657: Indigenous organisations, by and la
- Page 658 and 659: • Coordination and decision makin
- Page 660 and 661: Box 11.5.4 (continued)The Board of
- Page 662 and 663: Box 11.5.6 (continued)3. Are effect
- Page 664 and 665: Box 11.5.8 (continued)The Pitjantja
- Page 666 and 667: Box 11.5.10 Governance trainingWuna
- Page 668 and 669: • strategic policy and evaluation
- Page 670 and 671: Box 11.5.13 Developing youth leader
- Page 672 and 673: third parties enter into an equal a
- Page 674 and 675: The OIPC red tape evaluation (OIPC
- Page 676 and 677: old. Some will be new’ (Cornell a
- Page 678 and 679: circumstances or risk profile of th
- Page 680 and 681: 11.6 Future directions in dataEmplo
- Page 682 and 683: Table 11A.1.10 Occupation skill lev
- Page 684 and 685: 11.3 Indigenous owned or controlled
- Page 686 and 687: Gerritson, R. 2001, Community Capac
- Page 688 and 689: Reconciliation Australia 2006b, 200
- Page 690 and 691: Torres Strait Islander people compr
- Page 692 and 693:
Labour force participation and unem
- Page 694 and 695:
section 12.1). The files containing
- Page 696 and 697:
Attachment tablesAttachment tables
- Page 698 and 699:
Patterns of relative disadvantage b
- Page 700 and 701:
13.1.2 Differences between women an
- Page 702 and 703:
Figure 13.1.3 Relative disadvantage
- Page 704 and 705:
13.2 Associations between headline
- Page 706 and 707:
Figure 13.2.2 People aged 15 years
- Page 708 and 709:
Figure 13.2.4 People aged 15 years
- Page 710 and 711:
Box 13.3.1 (continued)For example,
- Page 712 and 713:
• more common among unemployed pe
- Page 714 and 715:
13.4 Notes on methodologyThe analys
- Page 716 and 717:
13.22 OVERCOMINGINDIGENOUSDISADVANT
- Page 718 and 719:
• reviewing and re-engineering pr
- Page 720 and 721:
The working group will consider how
- Page 722 and 723:
Australian Government commentsThe f
- Page 724 and 725:
New South Wales Government comments
- Page 726 and 727:
Victorian Government commentsIn Oct
- Page 728 and 729:
Queensland Government commentsThe Q
- Page 730 and 731:
Western Australian Government comme
- Page 732 and 733:
South Australian Government comment
- Page 734 and 735:
Tasmanian Government commentsThe Ta
- Page 736 and 737:
Australian Capital Territory Govern
- Page 738 and 739:
Northern Territory Government comme
- Page 740 and 741:
IMPLEMENTATION OFTHE FRAMEWORKA2.21
- Page 742 and 743:
Figure A3.2 Proportion of the popul
- Page 744 and 745:
• The proportion of the Indigenou
- Page 746 and 747:
e disaggregated by different factor
- Page 748 and 749:
identify when asked by police. Henc
- Page 750 and 751:
Indicators Measures Data sources3 H
- Page 752 and 753:
Indicator Measure Data source3.5 La
- Page 754 and 755:
Indicator Measure Data source3.10 D
- Page 756 and 757:
Indicator Measure Data source5.5 Ch
- Page 758 and 759:
Indicator Measure Data source7.5 Tr
- Page 760 and 761:
Indicator Measure Data source9.2 Re
- Page 762 and 763:
Indicator Measure Data source9.5 Pr
- Page 764 and 765:
Indicator Measure Data source11 Eco
- Page 766 and 767:
Acronyms and abbreviationsABSACERAI
- Page 768:
Australia 1995-2003, Trends and Iss