trimestre - Indetec
trimestre - Indetec
trimestre - Indetec

Create successful ePaper yourself
Turn your PDF publications into a flip-book with our unique Google optimized e-Paper software.
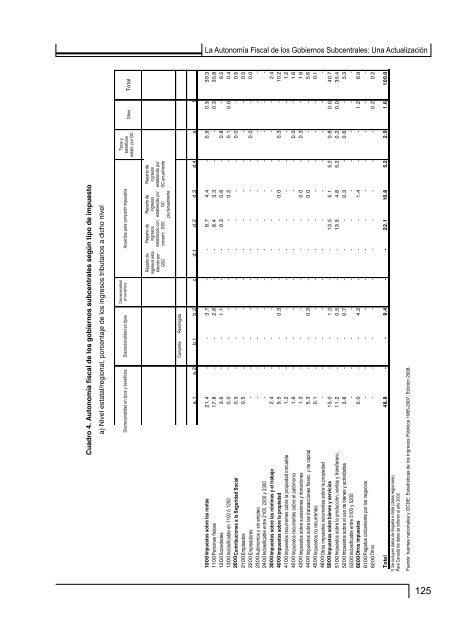
La Autonomía Fiscal de los Gobiernos Subcentrales: Una Actualización<br />
Cuadro 4. Autonomía fiscal de los gobiernos subcentrales según tipo de impuesto<br />
a) Nivel estatal/regional, porcentaje de los ingresos tributarios a dicho nivel<br />
Discrecionalidad Discretion en tipos on rates y beneficios and Discrecionalidad en tipos<br />
Dis cretion on rates<br />
reliefs<br />
Discrecionalidad<br />
Discretion<br />
en beneficios Acuerdos para compartir impuestos<br />
Tax sharing arrangements<br />
on reliefs<br />
Tipos y<br />
Rates beneficios and<br />
reliefs establ. por set GC<br />
by CG<br />
Other Otros Total<br />
Completa Restringida<br />
Full Restricted<br />
Reparto de<br />
ingresos esta<br />
Revenue<br />
blecido por<br />
GSC<br />
split set by<br />
SCG<br />
Reparto de<br />
Revenue ingresos<br />
establecido split set con<br />
consent. GSC<br />
with SCG<br />
consent<br />
Reparto de<br />
Revenue ingresos<br />
s establecido plit set por by<br />
GC<br />
plurianualmente<br />
CG,<br />
pluriannual<br />
Reparto de<br />
Revenue ingresos<br />
split establecido set by por<br />
GC anualmente<br />
CG,<br />
annual<br />
a.1 a.2 b.1 b.2 c d.1 d.2 d.3 d.4 e f<br />
1000 Impuestos Taxes on sobre income, las rentas profits and capital gains 21.4 - - 3.7 - - 8.7 4.4 - 0.9 0.3 39.3<br />
1100 Personas Of individuals físicas<br />
17.8<br />
2.6<br />
8.4 3.3<br />
0.3 35.8<br />
1200 Sociedades C orporate<br />
3.6<br />
1.1<br />
0.3 0.8<br />
0.8<br />
6.5<br />
1300 Inclasificable U nallocable en between 1100 ó 1200 1100 and 1200<br />
0.0<br />
0.2<br />
0.1 0.0 0.4<br />
2000 Contribuciones Social security a la contributions Seguridad Social<br />
0.5 - - - - - - - - 0.0 - 0.5<br />
2100 Empleados Employees<br />
0.5<br />
0.5<br />
2200 Empleadores Employers<br />
0.0<br />
0.0<br />
2300 Self-employed or non-employed<br />
Autónomos y sin empleo<br />
Inclasificable entre 2100, 2200 y 2300<br />
Impuestos sobre las nóminas y el trabajo<br />
Impuestos sobre la propiedad<br />
2400 U nallocable between 2100, 2200 and 2300 - - - - - - - - - - - -<br />
3000 Taxes on payro ll and workforce 2.4 - - - - - - - - - - 2.4<br />
4000 Taxes on property 9.5 - - 0.3 - - - 0.0 - 0.3 - 10.2<br />
4100 Impuestos R ecurrent recurrentes taxes on sobre immovable la propiedad property inmueble<br />
1.2<br />
1.2<br />
4200 Impuestos R ecurrent recurrentes taxes on sobre net el wealth patrimonio<br />
1.6<br />
0.0<br />
1.6<br />
4300 Impuestos Estate, inheritance<br />
sobre sucesiones and y gift donaciones taxes<br />
1.3<br />
0.0<br />
0.3<br />
1.6<br />
4400 Impuestos Taxes on sobre financial las transacciones and capital financ. trans y de actions capital<br />
5.3 - - 0.3 - - - 0.0 - - - 5.6<br />
4500 Impuestos N on-recurrent no recurrentes taxes<br />
0.1<br />
0.1<br />
4600 Otros Other impuestos recurrent recurrentes taxes on sobre property la propiedad<br />
5000 Impuestos Taxes on sobre goods bienes and y servicios services 15.0 - - 1.2 - - 13.5 5.1 5.2 0.8 0.0 40.7<br />
5100 Impuestos Taxes on sobre production, la producción, sale, ventas transfer, y transferenc. etc 11.2 - - 0.5 - - 13.5 4.8 5.2 0.2 0.0 35.4<br />
5200 Impuestos Taxes on sobre use el of uso goods de bienes and y perform actividades activities 3.8 - - 0.7 - - - 0.3 - 0.6 - 5.3<br />
5300 Inclasificable U nallocable entre between 5100 y 5200 5100 and 5200<br />
6000 Otros Oth er impuestos taxes 0.0 - - 4.2 - - - 1.4 - - 1.2 6.9<br />
6100 Pagados Paid solely únicamente by bus por iness los negocios<br />
6200 Otros Other<br />
0.2 0.2<br />
Total<br />
1) 1) Se incluyen Including datos Italy de España and e Spain Italia (datos (regional regionales) data).<br />
Para<br />
For<br />
Canadá<br />
Canada<br />
los datos<br />
data<br />
se refieren<br />
refer<br />
al<br />
to<br />
año<br />
the<br />
2002<br />
year 2002.<br />
48.8<br />
Fuente: fuentes nacionales y OCDE: Estadísticas de los Ingresos Públicos 1965-2007, Edición 2008.<br />
9.4<br />
22.1<br />
10.8<br />
5.2<br />
2.0<br />
1.6<br />
100.0<br />
-<br />
-<br />
-<br />
-<br />
-<br />
-<br />
-<br />
-<br />
-<br />
-<br />
-<br />
-<br />
-<br />
-<br />
-<br />
-<br />
-<br />
-<br />
-<br />
-<br />
-<br />
-<br />
-<br />
-<br />
-<br />
-<br />
-<br />
-<br />
-<br />
-<br />
-<br />
-<br />
-<br />
-<br />
-<br />
-<br />
-<br />
-<br />
-<br />
-<br />
-<br />
-<br />
-<br />
-<br />
-<br />
-<br />
-<br />
-<br />
-<br />
-<br />
-<br />
-<br />
-<br />
-<br />
-<br />
-<br />
-<br />
-<br />
-<br />
-<br />
-<br />
-<br />
-<br />
-<br />
-<br />
-<br />
-<br />
-<br />
-<br />
-<br />
-<br />
-<br />
-<br />
-<br />
-<br />
-<br />
-<br />
-<br />
-<br />
-<br />
-<br />
-<br />
-<br />
-<br />
-<br />
-<br />
-<br />
-<br />
-<br />
-<br />
-<br />
-<br />
-<br />
-<br />
-<br />
-<br />
-<br />
-<br />
-<br />
-<br />
-<br />
-<br />
-<br />
-<br />
-<br />
-<br />
-<br />
-<br />
-<br />
-<br />
-<br />
-<br />
-<br />
-<br />
-<br />
-<br />
-<br />
-<br />
-<br />
-<br />
-<br />
-<br />
-<br />
-<br />
-<br />
-<br />
-<br />
-<br />
-<br />
-<br />
-<br />
-<br />
-<br />
-<br />
-<br />
-<br />
-<br />
-<br />
125