- Page 1 and 2:
fiscal trimestre ISSN 0188-6088 El
- Page 4:
Contenido El Financiamiento de los
- Page 7 and 8:
Trimestre Fiscal Nº 97 El primer a
- Page 9 and 10:
Trimestre Fiscal Nº 97 jurisdiccio
- Page 12:
El Financiamiento de los Gobiernos
- Page 15 and 16:
Trimestre Fiscal Nº 97 de los recu
- Page 17 and 18:
Trimestre Fiscal Nº 97 brechas de
- Page 19 and 20:
Trimestre Fiscal Nº 97 CEPAL - Ser
- Page 21 and 22:
20 Trimestre Fiscal Nº 97 óptima
- Page 23 and 24: 22 Trimestre Fiscal Nº 97 III. La
- Page 25 and 26: crecido considerablemente en los ú
- Page 27 and 28: Trimestre Fiscal Nº 97 los niveles
- Page 29 and 30: PAL - Serie Macroeconomía del desa
- Page 31 and 32: 30 Trimestre Fiscal Nº 97 excluyen
- Page 33 and 34: Trimestre Fiscal Nº 97 y no de la
- Page 35 and 36: Trimestre Fiscal Nº 97 de gobierno
- Page 37 and 38: 36 Trimestre Fiscal Nº 97 por todo
- Page 39 and 40: Trimestre Fiscal Nº 97 RECUADRO 1
- Page 41 and 42: Trimestre Fiscal Nº 97 suelen ser
- Page 43 and 44: 42 Trimestre Fiscal Nº 97 legislac
- Page 45 and 46: Trimestre Fiscal Nº 97 Tomando en
- Page 47 and 48: 46 Trimestre Fiscal Nº 97 Debe rec
- Page 49 and 50: 48 Trimestre Fiscal Nº 97 actos y
- Page 51 and 52: 50 Trimestre Fiscal Nº 97 Por un l
- Page 53 and 54: Trimestre Fiscal Nº 97 B. El marco
- Page 55 and 56: Trimestre Fiscal Nº 97 Cuadro 4 (c
- Page 57 and 58: 56 Trimestre Fiscal Nº 97 transfer
- Page 59 and 60: Trimestre Fiscal Nº 97 Bibliograf
- Page 61 and 62: Trimestre Fiscal Nº 97 Uribe, M.C.
- Page 64 and 65: Impuestos y Transferencias de Fondo
- Page 66 and 67: Impuestos y Transferencias de Fondo
- Page 68 and 69: Impuestos y Transferencias de Fondo
- Page 70 and 71: Impuestos y Transferencias de Fondo
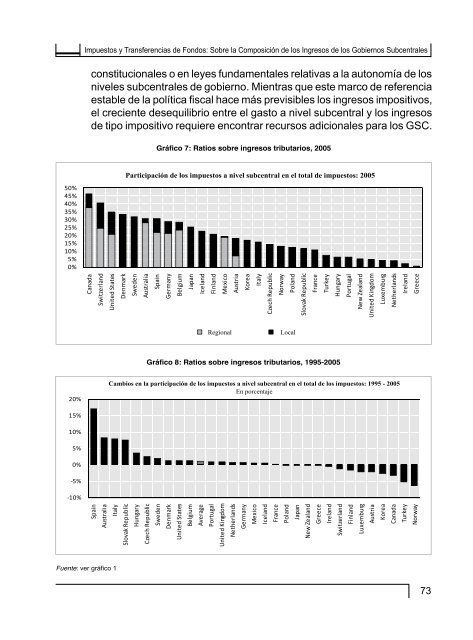
- Page 72 and 73: Impuestos y Transferencias de Fondo
- Page 76 and 77: Impuestos y Transferencias de Fondo
- Page 78 and 79: Impuestos y Transferencias de Fondo
- Page 80 and 81: 20% 5000 Impuestos sobre bienes y s
- Page 82 and 83: Impuestos y Transferencias de Fondo
- Page 84 and 85: Impuestos y Transferencias de Fondo
- Page 86 and 87: Impuestos y Transferencias de Fondo
- Page 88 and 89: Transferencias de nivelación y su
- Page 90 and 91: Impuestos y Transferencias de Fondo
- Page 92 and 93: Impuestos y Transferencias de Fondo
- Page 94 and 95: Impuestos y Transferencias de Fondo
- Page 96 and 97: Impuestos y Transferencias de Fondo
- Page 98 and 99: Impuestos y Transferencias de Fondo
- Page 100 and 101: Impuestos y Transferencias de Fondo
- Page 102 and 103: Impuestos y Transferencias de Fondo
- Page 104 and 105: Impuestos y Transferencias de Fondo
- Page 106 and 107: Impuestos y Transferencias de Fondo
- Page 108 and 109: Impuestos y Transferencias de Fondo
- Page 110 and 111: Impuestos y Transferencias de Fondo
- Page 112 and 113: COM/CTPA/ECO/GOV/WP(2009)7 Impuesto
- Page 114: COM/CTPA/ECO/GOV/WP(2009)7 Impuesto
- Page 118 and 119: La Autonomía Fiscal de los Gobiern
- Page 120 and 121: La Autonomía Fiscal de los Gobiern
- Page 122 and 123: La Autonomía Fiscal de los Gobiern
- Page 124 and 125:
La Autonomía Fiscal de los Gobiern
- Page 126 and 127:
La Autonomía Fiscal de los Gobiern
- Page 128 and 129:
La Autonomía Fiscal de los Gobiern
- Page 130 and 131:
País Australia Austria Bélgica Re
- Page 132 and 133:
3.1. Donantes y receptores de trans
- Page 134 and 135:
La Autonomía Fiscal de los Gobiern
- Page 136 and 137:
La Autonomía Fiscal de los Gobiern
- Page 138 and 139:
La Autonomía Fiscal de los Gobiern
- Page 140 and 141:
La Autonomía Fiscal de los Gobiern
- Page 142:
Reforma Fiscal y Relaciones Fiscale
- Page 145 and 146:
144 Trimestre Fiscal Nº 97 Adicion
- Page 147 and 148:
Trimestre Fiscal Nº 97 décadas. N
- Page 149 and 150:
148 Trimestre Fiscal Nº 97 al ingr
- Page 151 and 152:
150 Trimestre Fiscal Nº 97 federal
- Page 153 and 154:
152 Trimestre Fiscal Nº 97 Una con
- Page 155 and 156:
Trimestre 264 Fiscal CRECIMIENTO N
- Page 157 and 158:
Trimestre Fiscal Nº 97 independenc
- Page 159 and 160:
158 Trimestre Fiscal Nº 97 Lo ante
- Page 161 and 162:
160 Trimestre Fiscal Nº 97 años r
- Page 163 and 164:
Trimestre Fiscal Nº 97 confunde la
- Page 165 and 166:
164 Trimestre Fiscal Nº 97 especia
- Page 167 and 168:
Trimestre Fiscal Nº 97 en función
- Page 169 and 170:
Trimestre Fiscal Nº 97 transferenc
- Page 171 and 172:
Trimestre Fiscal Nº 97 278 CRECIMI
- Page 173 and 174:
280 CRECIMIENTO ECONÓMICO Y EQUIDA
- Page 175 and 176:
Trimestre Fiscal Nº 97 facultades
- Page 177 and 178:
176 Trimestre Fiscal Nº 97 Sobre e
- Page 179 and 180:
178 Trimestre Fiscal Nº 97 el cons
- Page 181 and 182:
180 Trimestre Fiscal Nº 97 una ref
- Page 183 and 184:
Trimestre Fiscal Nº 97 shcp, 2006.
- Page 186 and 187:
Transferencias Intergubernamentales
- Page 188 and 189:
Transferencias Intergubernamentales
- Page 190 and 191:
Transferencias Intergubernamentales
- Page 192 and 193:
Transferencias Intergubernamentales
- Page 194 and 195:
Transferencias Intergubernamentales
- Page 196 and 197:
Transferencias Intergubernamentales
- Page 198 and 199:
Transferencias Intergubernamentales
- Page 200 and 201:
Transferencias Intergubernamentales
- Page 202 and 203:
Transferencias Intergubernamentales
- Page 204 and 205:
Transferencias Intergubernamentales
- Page 206 and 207:
Transferencias Intergubernamentales
- Page 208 and 209:
El Enfoque del Burócrata Maximizad
- Page 210 and 211:
Transferencias Intergubernamentales
- Page 212 and 213:
Transferencias Intergubernamentales
- Page 214 and 215:
Transferencias Intergubernamentales
- Page 216 and 217:
Transferencias Intergubernamentales
- Page 218:
Transferencias Intergubernamentales
- Page 222 and 223:
Desempeño Macroeconómico en Siste
- Page 224 and 225:
Desempeño Macroeconómico en Siste
- Page 226 and 227:
Desempeño Macroeconómico en Siste
- Page 228 and 229:
Desempeño Macroeconómico en Siste
- Page 230 and 231:
Desempeño Macroeconómico en Siste
- Page 232 and 233:
Desempeño Macroeconómico en Siste
- Page 234 and 235:
Desempeño Macroeconómico en Siste
- Page 236 and 237:
Desempeño Macroeconómico en Siste
- Page 238 and 239:
Desempeño Macroeconómico en Siste
- Page 240 and 241:
Desempeño Macroeconómico en Siste
- Page 242 and 243:
Desempeño Macroeconómico en Siste
- Page 244 and 245:
Desempeño Macroeconómico en Siste
- Page 246 and 247:
Desempeño Macroeconómico en Siste
- Page 248 and 249:
Desempeño Macroeconómico en Siste
- Page 250 and 251:
186 EnToRno InSTITuCIonAL dE LA GES
- Page 252 and 253:
188 EnToRno InSTITuCIonAL dE LA GES
- Page 254 and 255:
Desempeño Macroeconómico en Siste
- Page 256 and 257:
Desempeño Macroeconómico en Siste
- Page 258 and 259:
Desempeño Macroeconómico en Siste
- Page 260 and 261:
Desempeño Macroeconómico en Siste
- Page 262:
Son estas instituciones fiscales la
- Page 266 and 267:
Las Relaciones Fiscales Intergubern
- Page 268 and 269:
Las Relaciones Fiscales Intergubern
- Page 270 and 271:
Las Relaciones Fiscales Intergubern
- Page 272 and 273:
Las Relaciones Fiscales Intergubern
- Page 274 and 275:
la década de los noventa a superá
- Page 276 and 277:
Las Relaciones Fiscales Intergubern
- Page 278 and 279:
los menores montos de deuda de esto
- Page 280 and 281:
Las Relaciones Fiscales Intergubern
- Page 282 and 283:
Las Relaciones Fiscales Intergubern
- Page 284 and 285:
la circulación de mercaderías y p
- Page 286 and 287:
Las Relaciones Fiscales Intergubern
- Page 288 and 289:
Las Relaciones Fiscales Intergubern
- Page 290 and 291:
Las Relaciones Fiscales Intergubern
- Page 292 and 293:
Las Relaciones Fiscales Intergubern
- Page 294 and 295:
como en el caso de Chile, bajo valo
- Page 296 and 297:
En términos generales y como se ob
- Page 298 and 299:
Las Relaciones Fiscales Intergubern
- Page 300 and 301:
El gráfico 11 indica la evolución
- Page 302 and 303:
Tal como se observa en el gráfico
- Page 304 and 305:
Las Relaciones Fiscales Intergubern
- Page 306 and 307:
del PIB, lo que representa el 80% d
- Page 308 and 309:
Por su parte, las aportaciones fede
- Page 310 and 311:
Las Relaciones Fiscales Intergubern
- Page 312 and 313:
Las Relaciones Fiscales Intergubern
- Page 314 and 315:
Las Relaciones Fiscales Intergubern
- Page 316 and 317:
Las Relaciones Fiscales Intergubern
- Page 318 and 319:
Las Relaciones Fiscales Intergubern
- Page 320 and 321:
categorías: política monetaria y
- Page 322 and 323:
Las Relaciones Fiscales Intergubern
- Page 324 and 325:
Las Relaciones Fiscales Intergubern
- Page 326 and 327:
Las Relaciones Fiscales Intergubern
- Page 328 and 329:
Sin embargo, la relación del grado
- Page 330 and 331:
Las Relaciones Fiscales Intergubern
- Page 332 and 333:
Las Relaciones Fiscales Intergubern
- Page 334 and 335:
Referencias bibliográficas Las Rel