- Page 1 and 2:
ISBN 978-86-83059-06-5Editor-in-Chi
- Page 3 and 4:
TRANSPORT OF DANGEROUS GOODSAND RIS
- Page 5 and 6:
EDITORIALLand transport Pan- Europe
- Page 7 and 8:
Contents:INTEGRATED MODEL AND INFOR
- Page 9 and 10:
TRANSPORT OF DANGEROUS GOODS AND RI
- Page 11 and 12:
TRANSPORT OF DANGEROUS GOODS AND RI
- Page 13 and 14:
TRANSPORT OF DANGEROUS GOODS AND RI
- Page 15 and 16:
TRANSPORT OF DANGEROUS GOODS AND RI
- Page 17 and 18:
Figure 3. Algorithm of Security Dat
- Page 19 and 20:
Figure 5. Algorithm of Ship Waste M
- Page 21 and 22:
Figure 7. Original Algorithm of Imp
- Page 23 and 24:
TRANSPORT OF DANGEROUS GOODS AND RI
- Page 25 and 26:
Figure 11. Original Algorithm of th
- Page 27 and 28:
Figure 13. Original Algorithm of th
- Page 29 and 30:
Figure 15. Original Algorithm of Ot
- Page 31 and 32:
TRANSPORT OF DANGEROUS GOODS AND RI
- Page 33 and 34:
Figure 18. The original algorithm o
- Page 35 and 36:
Figure 20. Original Algorithm of Ac
- Page 37 and 38:
TRANSPORT OF DANGEROUS GOODS AND RI
- Page 39 and 40:
Figure 23. Original Algorithm of In
- Page 41 and 42:
Figure 25. Original Algorithm of Ac
- Page 43 and 44:
TRANSPORT OF DANGEROUS GOODS AND RI
- Page 45 and 46:
TRANSPORT OF DANGEROUS GOODS AND RI
- Page 47 and 48:
TRANSPORT OF DANGEROUS GOODS AND RI
- Page 49 and 50:
TRANSPORT OF DANGEROUS GOODS AND RI
- Page 51 and 52:
TRANSPORT OF DANGEROUS GOODS AND RI
- Page 53 and 54:
TRANSPORT OF DANGEROUS GOODS AND RI
- Page 55 and 56:
TRANSPORT OF DANGEROUS GOODS AND RI
- Page 57 and 58:
TRANSPORT OF DANGEROUS GOODS AND RI
- Page 59 and 60:
Table 1. Classification of waste th
- Page 61 and 62:
Table 3 Classification of waste tha
- Page 63 and 64:
Table 3b Classification of waste th
- Page 65 and 66:
Table 3d: Classification of waste t
- Page 67 and 68:
Table 3f: Classification of waste t
- Page 69 and 70:
TRANSPORT OF DANGEROUS GOODS AND RI
- Page 71 and 72:
TRANSPORT OF DANGEROUS GOODS AND RI
- Page 73 and 74:
TRANSPORT OF DANGEROUS GOODS AND RI
- Page 75 and 76:
Table 6 Classes of the compounds th
- Page 77 and 78: Table 6b Classes of the compounds t
- Page 79 and 80: TRANSPORT OF DANGEROUS GOODS AND RI
- Page 81 and 82: TRANSPORT OF DANGEROUS GOODS AND RI
- Page 83 and 84: TRANSPORT OF DANGEROUS GOODS AND RI
- Page 85 and 86: Table 8. Typical hazardous waste ma
- Page 87 and 88: Figure 5.- Life cycle for oiled sol
- Page 89 and 90: TRANSPORT OF DANGEROUS GOODS AND RI
- Page 91 and 92: TRANSPORT OF DANGEROUS GOODS AND RI
- Page 93 and 94: TRANSPORT OF DANGEROUS GOODS AND RI
- Page 95 and 96: TRANSPORT OF DANGEROUS GOODS AND RI
- Page 97 and 98: TRANSPORT OF DANGEROUS GOODS AND RI
- Page 99 and 100: TRANSPORT OF DANGEROUS GOODS AND RI
- Page 101 and 102: TRANSPORT OF DANGEROUS GOODS AND RI
- Page 103 and 104: TRANSPORT OF DANGEROUS GOODS AND RI
- Page 105 and 106: Figure 13. Original algorithm of th
- Page 107 and 108: Software part of Sledat systemTRANS
- Page 109 and 110: BIBLIOGRAPHYTRANSPORT OF DANGEROUS
- Page 111 and 112: TRANSPORT OF DANGEROUS GOODS AND RI
- Page 113 and 114: TRANSPORT OF DANGEROUS GOODS AND RI
- Page 115 and 116: TRANSPORT OF DANGEROUS GOODS AND RI
- Page 117 and 118: TRANSPORT OF DANGEROUS GOODS AND RI
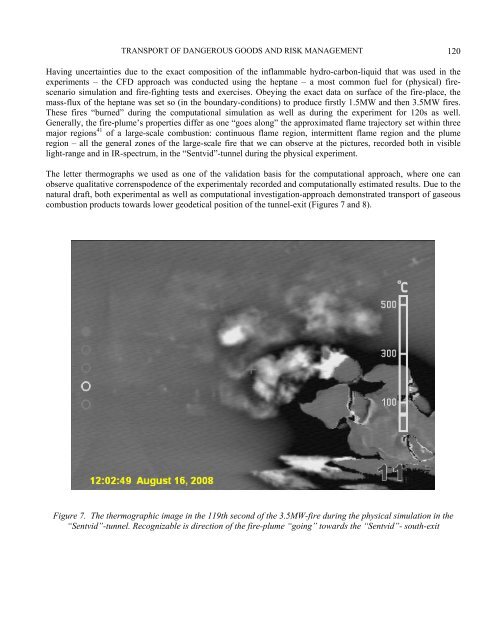
- Page 119 and 120: TRANSPORT OF DANGEROUS GOODS AND RI
- Page 121 and 122: UDK:614.83:624.21TRANSPORT OF DANGE
- Page 123 and 124: TRANSPORT OF DANGEROUS GOODS AND RI
- Page 125 and 126: TRANSPORT OF DANGEROUS GOODS AND RI
- Page 127: TRANSPORT OF DANGEROUS GOODS AND RI
- Page 131 and 132: TRANSPORT OF DANGEROUS GOODS AND RI
- Page 133 and 134: TRANSPORT OF DANGEROUS GOODS AND RI
- Page 135 and 136: TRANSPORT OF DANGEROUS GOODS AND RI
- Page 137 and 138: TRANSPORT OF DANGEROUS GOODS AND RI
- Page 139 and 140: TRANSPORT OF DANGEROUS GOODS AND RI
- Page 141 and 142: TRANSPORT OF DANGEROUS GOODS AND RI
- Page 143 and 144: TRANSPORT OF DANGEROUS GOODS AND RI
- Page 145 and 146: TRANSPORT OF DANGEROUS GOODS AND RI
- Page 147 and 148: TRANSPORT OF DANGEROUS GOODS AND RI
- Page 149 and 150: TRANSPORT OF DANGEROUS GOODS AND RI
- Page 151 and 152: TRANSPORT OF DANGEROUS GOODS AND RI
- Page 153 and 154: TRANSPORT OF DANGEROUS GOODS AND RI
- Page 155 and 156: TRANSPORT OF DANGEROUS GOODS AND RI
- Page 157 and 158: TRANSPORT OF DANGEROUS GOODS AND RI
- Page 159 and 160: TRANSPORT OF DANGEROUS GOODS AND RI
- Page 161 and 162: TRANSPORT OF DANGEROUS GOODS AND RI
- Page 163 and 164: TRANSPORT OF DANGEROUS GOODS AND RI
- Page 165 and 166: TRANSPORT OF DANGEROUS GOODS AND RI
- Page 167 and 168: TRANSPORT OF DANGEROUS GOODS AND RI
- Page 169 and 170: TRANSPORT OF DANGEROUS GOODS AND RI
- Page 171 and 172: TRANSPORT OF DANGEROUS GOODS AND RI
- Page 173 and 174: TRANSPORT OF DANGEROUS GOODS AND RI
- Page 175 and 176: TRANSPORT OF DANGEROUS GOODS AND RI
- Page 177 and 178: INTEGRATED C4I SYSTEMSTRANSPORT OF
- Page 179 and 180:
TRANSPORT OF DANGEROUS GOODS AND RI
- Page 181 and 182:
TRANSPORT OF DANGEROUS GOODS AND RI
- Page 183 and 184:
TRANSPORT OF DANGEROUS GOODS AND RI
- Page 185 and 186:
TRANSPORT OF DANGEROUS GOODS AND RI
- Page 187 and 188:
TRANSPORT OF DANGEROUS GOODS AND RI
- Page 189 and 190:
TRANSPORT OF DANGEROUS GOODS AND RI
- Page 191 and 192:
TRANSPORT OF DANGEROUS GOODS AND RI
- Page 193 and 194:
TRANSPORT OF DANGEROUS GOODS AND RI
- Page 195 and 196:
TRANSPORT OF DANGEROUS GOODS AND RI
- Page 197 and 198:
TRANSPORT OF DANGEROUS GOODS AND RI
- Page 199 and 200:
TRANSPORT OF DANGEROUS GOODS AND RI
- Page 201 and 202:
TRANSPORT OF DANGEROUS GOODS AND RI
- Page 203 and 204:
TRANSPORT OF DANGEROUS GOODS AND RI
- Page 205 and 206:
TRANSPORT OF DANGEROUS GOODS AND RI
- Page 207 and 208:
TRANSPORT OF DANGEROUS GOODS AND RI
- Page 209 and 210:
TRANSPORT OF DANGEROUS GOODS AND RI
- Page 211 and 212:
UDK:355.69614.878.084TRANSPORT OF D
- Page 213 and 214:
TRANSPORT OF DANGEROUS GOODS AND RI
- Page 215 and 216:
TRANSPORT OF DANGEROUS GOODS AND RI
- Page 217 and 218:
TRANSPORT OF DANGEROUS GOODS AND RI
- Page 219 and 220:
TRANSPORT OF DANGEROUS GOODS AND RI
- Page 221 and 222:
TRANSPORT OF DANGEROUS GOODS AND RI
- Page 223 and 224:
TRANSPORT OF DANGEROUS GOODS AND RI
- Page 225 and 226:
TRANSPORT OF DANGEROUS GOODS AND RI
- Page 227 and 228:
TRANSPORT OF DANGEROUS GOODS AND RI
- Page 229 and 230:
TRANSPORT OF DANGEROUS GOODS AND RI
- Page 231 and 232:
TRANSPORT OF DANGEROUS GOODS AND RI
- Page 233 and 234:
TRANSPORT OF DANGEROUS GOODS AND RI
- Page 235 and 236:
TRANSPORT OF DANGEROUS GOODS AND RI
- Page 237 and 238:
TRANSPORT OF DANGEROUS GOODS AND RI
- Page 239 and 240:
TRANSPORT OF DANGEROUS GOODS AND RI
- Page 241 and 242:
TRANSPORT OF DANGEROUS GOODS AND RI
- Page 243 and 244:
TRANSPORT OF DANGEROUS GOODS AND RI
- Page 245 and 246:
TRANSPORT OF DANGEROUS GOODS AND RI
- Page 247 and 248:
TRANSPORT OF DANGEROUS GOODS AND RI
- Page 249 and 250:
TRANSPORT OF DANGEROUS GOODS AND RI
- Page 251 and 252:
TRANSPORT OF DANGEROUS GOODS AND RI
- Page 253 and 254:
Oil, gas and mineralsTRANSPORT OF D
- Page 255 and 256:
TRANSPORT OF DANGEROUS GOODS AND RI
- Page 257 and 258:
UDK:811.111'25TRANSPORT OF DANGEROU
- Page 259 and 260:
TRANSPORT OF DANGEROUS GOODS AND RI
- Page 261 and 262:
TRANSPORT OF DANGEROUS GOODS AND RI
- Page 263 and 264:
TRANSPORT OF DANGEROUS GOODS AND RI
- Page 265 and 266:
TRANSPORT OF DANGEROUS GOODS AND RI
- Page 267:
CIP - Каталогизација