L'autonomisation des ruraux pauvres et la volatilité des politiques en ...
L'autonomisation des ruraux pauvres et la volatilité des politiques en ...
L'autonomisation des ruraux pauvres et la volatilité des politiques en ...

You also want an ePaper? Increase the reach of your titles
YUMPU automatically turns print PDFs into web optimized ePapers that Google loves.
Autonomisation <strong>des</strong> Ruraux Pauvres <strong>et</strong> Vo<strong>la</strong>tilité <strong>des</strong> Politiques de Développem<strong>en</strong>t <strong>en</strong> Tunisie<br />
Rapport de Synthèse, Mai 2006<br />
Fréqu<strong>en</strong>ce<br />
Fréqu<strong>en</strong>ce<br />
200<br />
100<br />
0<br />
200<br />
100<br />
0<br />
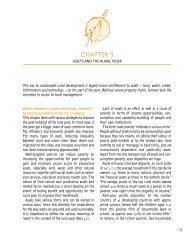
Score global attitude affective<br />
100,0<br />
95,0<br />
90,0<br />
85,0<br />
80,0<br />
75,0<br />
70,0<br />
65,0<br />
60,0<br />
55,0<br />
50,0<br />
45,0<br />
40,0<br />
35,0<br />
Score global attitude affective<br />
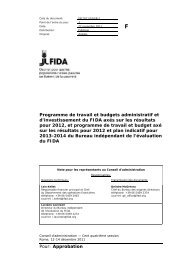
Score global attitude conative<br />
90,0<br />
85,0<br />
80,0<br />
75,0<br />
70,0<br />
65,0<br />
60,0<br />
55,0<br />
50,0<br />
45,0<br />
40,0<br />
35,0<br />
Score global attitude conative<br />
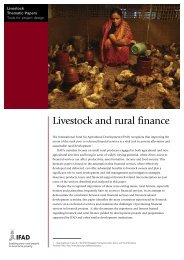
Sigma = 9,75<br />
Moy<strong>en</strong>ne = 82,8<br />
N = 605,00<br />
Sigma = 7,55<br />
Moy<strong>en</strong>ne = 73,5<br />
N = 605,00<br />
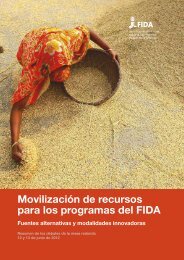
Score global attitude cognitive<br />
92,5<br />
90,0<br />
85,0<br />
87,5<br />
82,5<br />
77,5<br />
80,0<br />
75,0<br />
70,0<br />
72,5<br />
67,5<br />
62,5<br />
65,0<br />
60,0<br />
55,0<br />
57,5<br />
52,5<br />
47,5<br />
50,0<br />
45,0<br />
Score global attitude cognitive<br />
Chapitre III. Analyse <strong>et</strong> mesure <strong>des</strong> états <strong>des</strong> ag<strong>en</strong>ts individuels <strong>et</strong> leurs rapports avec l’autonomisation 59<br />
Fréqu<strong>en</strong>ce<br />
Figure 3.7. Distribution <strong>des</strong> scores globaux de l’attitude<br />
120<br />
100<br />
80<br />
60<br />
40<br />
20<br />
0<br />
Sigma = 6,35<br />
Moy<strong>en</strong>ne = 77,1<br />
N = 605,00<br />
La perception <strong>des</strong> normes <strong>et</strong> valeurs, de l’intérêt collectif <strong>et</strong> de <strong>la</strong> capacité d’adaptation<br />
Les courbes de distribution <strong>des</strong> scores globaux re<strong>la</strong>tifs à <strong>la</strong> perception <strong>des</strong> obj<strong>et</strong>s attitudinaux ont une<br />
allure normale. C<strong>et</strong>te perception s’appar<strong>en</strong>te beaucoup plus aux normes <strong>et</strong> valeurs (78) <strong>et</strong> à <strong>la</strong> capacité<br />
d’adaptation (77,8) qu’à l’intérêt collectif (74,7). L’analyse <strong>des</strong> différ<strong>en</strong>tes dim<strong>en</strong>sion de l’attitude <strong>des</strong><br />
suj<strong>et</strong>s vis-à-vis <strong>des</strong> obj<strong>et</strong>s attitudinaux montre que les suj<strong>et</strong>s ont t<strong>en</strong>dance à s’impliquer collectivem<strong>en</strong>t<br />
par rapport aux obj<strong>et</strong>s "parcours" <strong>et</strong> "administration" mais qu'ils s'impliqu<strong>en</strong>t plus individuellem<strong>en</strong>t par<br />
rapport aux obj<strong>et</strong>s, "cheptel" <strong>et</strong> "financem<strong>en</strong>t".<br />
Les suj<strong>et</strong>s développ<strong>en</strong>t une attitude affective ess<strong>en</strong>tiellem<strong>en</strong>t pour le cheptel, le parcours <strong>et</strong> le<br />
financem<strong>en</strong>t. Ils ont par contre une attitude cognitive pour l’administration, le financem<strong>en</strong>t <strong>et</strong><br />
l’infrastructure pastorale. Leur attitude est conative pour le parcours <strong>et</strong> le cheptel.