o caso da expansão do aeroporto santos ... - Rede PGV - UFRJ
o caso da expansão do aeroporto santos ... - Rede PGV - UFRJ
o caso da expansão do aeroporto santos ... - Rede PGV - UFRJ

You also want an ePaper? Increase the reach of your titles
YUMPU automatically turns print PDFs into web optimized ePapers that Google loves.
162<br />
3.1.1 Infra-Estrutura Aeroportuária no Mun<strong>do</strong><br />
O desenvolvimento <strong>da</strong> infra-estrutura <strong>do</strong> transporte aéreo mundial de maneira harmônica<br />
pode levar anos e até déca<strong>da</strong>s. Isto acontece porque o desenvolvimento está diretamente<br />
relaciona<strong>do</strong> com o incremento <strong>da</strong> deman<strong>da</strong>, tanto de passageiros quanto de carga (isto pode<br />
ser verifica<strong>do</strong> nas tabelas seguintes) e, por outro la<strong>do</strong>, está limita<strong>do</strong> por recursos financeiros e<br />
pelo impacto no meio ambiente local (IPCC, 1999).<br />
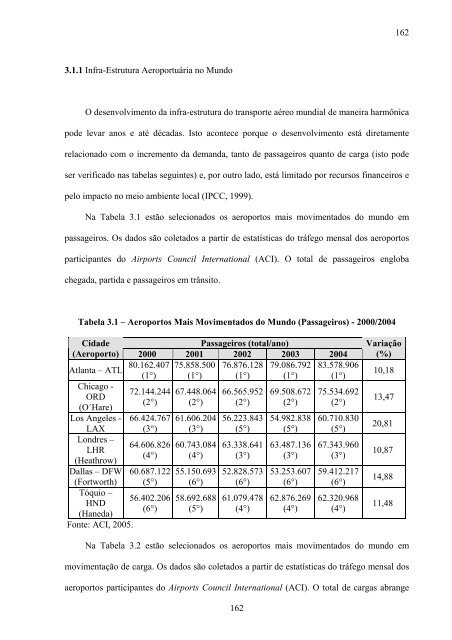
Na Tabela 3.1 estão seleciona<strong>do</strong>s os <strong>aeroporto</strong>s mais movimenta<strong>do</strong>s <strong>do</strong> mun<strong>do</strong> em<br />
passageiros. Os <strong>da</strong><strong>do</strong>s são coleta<strong>do</strong>s a partir de estatísticas <strong>do</strong> tráfego mensal <strong>do</strong>s <strong>aeroporto</strong>s<br />
participantes <strong>do</strong> Airports Council International (ACI). O total de passageiros engloba<br />
chega<strong>da</strong>, parti<strong>da</strong> e passageiros em trânsito.<br />
Tabela 3.1 – Aeroportos Mais Movimenta<strong>do</strong>s <strong>do</strong> Mun<strong>do</strong> (Passageiros) - 2000/2004<br />
Ci<strong>da</strong>de<br />
Passageiros (total/ano)<br />
(Aeroporto) 2000 2001 2002 2003 2004<br />
Atlanta – ATL 80.162.407 75.858.500 76.876.128 79.086.792 83.578.906<br />
(1°) (1°) (1°) (1°) (1°)<br />
Chicago -<br />
72.144.244 67.448.064 66.565.952 69.508.672 75.534.692<br />
ORD<br />
(2°) (2°) (2°) (2°) (2°)<br />
(O´Hare)<br />
Los Angeles -<br />
LAX<br />
Londres –<br />
LHR<br />
(Heathrow)<br />
Dallas – DFW<br />
(Fortworth)<br />
Tóquio –<br />
HND<br />
(Hane<strong>da</strong>)<br />
Fonte: ACI, 2005.<br />
66.424.767<br />
(3°)<br />
64.606.826<br />
(4°)<br />
60.687.122<br />
(5°)<br />
56.402.206<br />
(6°)<br />
61.606.204<br />
(3°)<br />
60.743.084<br />
(4°)<br />
55.150.693<br />
(6°)<br />
58.692.688<br />
(5°)<br />
56.223.843<br />
(5°)<br />
63.338.641<br />
(3°)<br />
52.828.573<br />
(6°)<br />
61.079.478<br />
(4°)<br />
54.982.838<br />
(5°)<br />
63.487.136<br />
(3°)<br />
53.253.607<br />
(6°)<br />
62.876.269<br />
(4°)<br />
60.710.830<br />
(5°)<br />
67.343.960<br />
(3°)<br />
59.412.217<br />
(6°)<br />
62.320.968<br />
(4°)<br />
Variação<br />
(%)<br />
10,18<br />
13,47<br />
20,81<br />
10,87<br />
14,88<br />
11,48<br />
Na Tabela 3.2 estão seleciona<strong>do</strong>s os <strong>aeroporto</strong>s mais movimenta<strong>do</strong>s <strong>do</strong> mun<strong>do</strong> em<br />
movimentação de carga. Os <strong>da</strong><strong>do</strong>s são coleta<strong>do</strong>s a partir de estatísticas <strong>do</strong> tráfego mensal <strong>do</strong>s<br />
<strong>aeroporto</strong>s participantes <strong>do</strong> Airports Council International (ACI). O total de cargas abrange<br />
162