Molecular beam epitaxial growth of III-V semiconductor ... - KOBRA
Molecular beam epitaxial growth of III-V semiconductor ... - KOBRA
Molecular beam epitaxial growth of III-V semiconductor ... - KOBRA

Create successful ePaper yourself
Turn your PDF publications into a flip-book with our unique Google optimized e-Paper software.
MBE Growth <strong>of</strong> Self-Assembled InAs and InGaAs Quantum Dots Embedded in<br />
Silicon Matrix<br />
which has been already introduced before for determination <strong>of</strong> local lattice distortions<br />
strain by geometric phase analysis, known as GPA strain (ε GP ii<br />
A ) and<br />
mathematically expressed by Eq. 5.8 [89]:<br />
ε ii = dmeasured InAs<br />
d bulk<br />
InAs<br />
− d bulk<br />
InAs<br />
(5.7)<br />
ε GP A<br />
ii<br />
= dmeasured loc<br />
− d measured<br />
ref<br />
d measured<br />
ref<br />
(5.8)<br />
The lattice mismatch f <strong>of</strong> Si/InAs system is expressed in-terms <strong>of</strong> the bulk<br />
lattice constants values <strong>of</strong> Si and InAs in Eq. 5.9:<br />
f = abulk InAs − abulk Si 6.055 − 5.431<br />
= = 11.55 % (5.9)<br />
a bulk<br />
Si<br />
5.431<br />
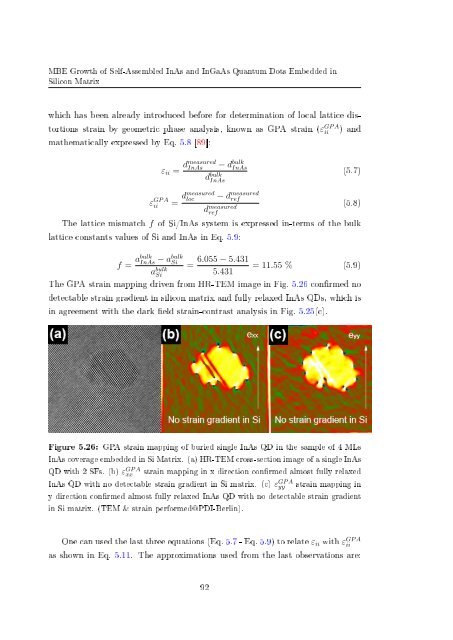
The GPA strain mapping driven from HR-TEM image in Fig. 5.26 conrmed no<br />
detectable strain gradient in silicon matrix and fully relaxed InAs QDs, which is<br />
in agreement with the dark eld strain-contrast analysis in Fig. 5.25(c).<br />
Figure 5.26: GPA strain mapping <strong>of</strong> buried single InAs QD in the sample <strong>of</strong> 4 MLs<br />
InAs coverage embedded in Si Matrix. (a) HR-TEM cross-section image <strong>of</strong> a single InAs<br />
QD with 2 SFs. (b) ε GP xx<br />
A strain mapping in x direction conrmed almost fully relaxed<br />
InAs QD with no detectable strain gradient in Si matrix. (c) ε GP yy<br />
A strain mapping in<br />
y direction conrmed almost fully relaxed InAs QD with no detectable strain gradient<br />
in Si matrix. (TEM & strain performed@PDI-Berlin).<br />
One can used the last three equations (Eq. 5.7 - Eq. 5.9) to relate ε ii with ε GP A<br />
ii<br />
as shown in Eq. 5.11. The approximations used from the last observations are:<br />
92