27 February 2007 - Ordinary Meeting of Council (pdf. 14MB)
27 February 2007 - Ordinary Meeting of Council (pdf. 14MB)
27 February 2007 - Ordinary Meeting of Council (pdf. 14MB)

You also want an ePaper? Increase the reach of your titles
YUMPU automatically turns print PDFs into web optimized ePapers that Google loves.
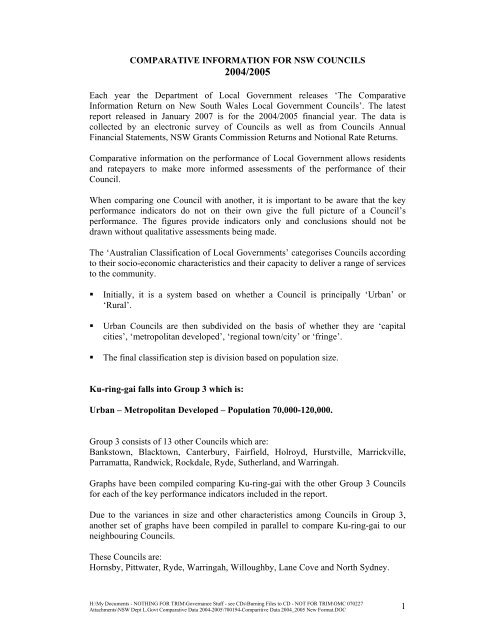
COMPARATIVE INFORMATION FOR NSW COUNCILS<br />
2004/2005<br />
Each year the Department <strong>of</strong> Local Government releases ‘The Comparative<br />
Information Return on New South Wales Local Government <strong>Council</strong>s’. The latest<br />
report released in January <strong>2007</strong> is for the 2004/2005 financial year. The data is<br />
collected by an electronic survey <strong>of</strong> <strong>Council</strong>s as well as from <strong>Council</strong>s Annual<br />
Financial Statements, NSW Grants Commission Returns and Notional Rate Returns.<br />
Comparative information on the performance <strong>of</strong> Local Government allows residents<br />
and ratepayers to make more informed assessments <strong>of</strong> the performance <strong>of</strong> their<br />
<strong>Council</strong>.<br />
When comparing one <strong>Council</strong> with another, it is important to be aware that the key<br />
performance indicators do not on their own give the full picture <strong>of</strong> a <strong>Council</strong>’s<br />
performance. The figures provide indicators only and conclusions should not be<br />
drawn without qualitative assessments being made.<br />
The ‘Australian Classification <strong>of</strong> Local Governments’ categorises <strong>Council</strong>s according<br />
to their socio-economic characteristics and their capacity to deliver a range <strong>of</strong> services<br />
to the community.<br />
• Initially, it is a system based on whether a <strong>Council</strong> is principally ‘Urban’ or<br />
‘Rural’.<br />
• Urban <strong>Council</strong>s are then subdivided on the basis <strong>of</strong> whether they are ‘capital<br />
cities’, ‘metropolitan developed’, ‘regional town/city’ or ‘fringe’.<br />
• The final classification step is division based on population size.<br />
Ku-ring-gai falls into Group 3 which is:<br />
Urban – Metropolitan Developed – Population 70,000-120,000.<br />
Group 3 consists <strong>of</strong> 13 other <strong>Council</strong>s which are:<br />
Bankstown, Blacktown, Canterbury, Fairfield, Holroyd, Hurstville, Marrickville,<br />
Parramatta, Randwick, Rockdale, Ryde, Sutherland, and Warringah.<br />
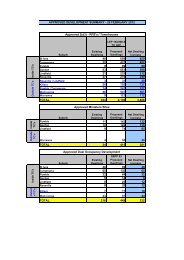
Graphs have been compiled comparing Ku-ring-gai with the other Group 3 <strong>Council</strong>s<br />
for each <strong>of</strong> the key performance indicators included in the report.<br />
Due to the variances in size and other characteristics among <strong>Council</strong>s in Group 3,<br />
another set <strong>of</strong> graphs have been compiled in parallel to compare Ku-ring-gai to our<br />
neighbouring <strong>Council</strong>s.<br />
These <strong>Council</strong>s are:<br />
Hornsby, Pittwater, Ryde, Warringah, Willoughby, Lane Cove and North Sydney.<br />
H:\My Documents - NOTHING FOR TRIM\Governance Stuff - see CDs\Burning Files to CD - NOT FOR TRIM\OMC 0702<strong>27</strong><br />
Attachments\NSW Dept L.Govt Comparative Data 2004-2005\700194-Comparitive Data 2004_2005 New Format.DOC<br />
1