- Page 1 and 2:
ORDINARY MEETING OF COUNCIL TO BE H
- Page 3 and 4:
GB.3 Policy on the Payment of Expen
- Page 5 and 6:
GB.10 Alcohol Free Zones 181 . File
- Page 7 and 8:
NM.3 Beechworth to Warragal Rezonin
- Page 9 and 10:
Ordinary Meeting of Council - 27 Fe
- Page 11 and 12:
Ordinary Meeting of Council - 27 Fe
- Page 13 and 14:
Ordinary Meeting of Council - 27 Fe
- Page 15 and 16:
Ordinary Meeting of Council - 27 Fe
- Page 17 and 18:
Ordinary Meeting of Council - 27 Fe
- Page 19 and 20:
Ordinary Meeting of Council - 27 Fe
- Page 21 and 22:
Ordinary Meeting of Council - 27 Fe
- Page 23 and 24:
Ordinary Meeting of Council - 27 Fe
- Page 25 and 26:
Ordinary Meeting of Council - 27 Fe
- Page 35 and 36:
Ordinary Meeting of Council - 27 Fe
- Page 37 and 38:
Ordinary Meeting of Council - 27 Fe
- Page 39 and 40:
Ordinary Meeting of Council - 27 Fe
- Page 41 and 42:
Ordinary Meeting of Council - 27 Fe
- Page 43 and 44:
Ordinary Meeting of Council - 27 Fe
- Page 45 and 46:
Ordinary Meeting of Council - 27 Fe
- Page 47 and 48:
Ordinary Meeting of Council - 27 Fe
- Page 49 and 50:
Ordinary Meeting of Council - 27 Fe
- Page 51 and 52:
Ordinary Meeting of Council - 27 Fe
- Page 53 and 54:
Ordinary Meeting of Council - 27 Fe
- Page 55 and 56:
Ordinary Meeting of Council - 27 Fe
- Page 57 and 58:
Ordinary Meeting of Council - 27 Fe
- Page 59 and 60:
Ordinary Meeting of Council - 27 Fe
- Page 61 and 62:
Ordinary Meeting of Council - 27 Fe
- Page 63 and 64:
Ordinary Meeting of Council - 27 Fe
- Page 65 and 66:
Ordinary Meeting of Council - 27 Fe
- Page 67 and 68:
Ordinary Meeting of Council - 27 Fe
- Page 69 and 70:
Ordinary Meeting of Council - 27 Fe
- Page 71 and 72:
Ordinary Meeting of Council - 27 Fe
- Page 73 and 74:
Ordinary Meeting of Council - 27 Fe
- Page 75 and 76:
Ordinary Meeting of Council - 27 Fe
- Page 77 and 78:
Ordinary Meeting of Council - 27 Fe
- Page 79 and 80:
Ordinary Meeting of Council - 27 Fe
- Page 81 and 82:
Ordinary Meeting of Council - 27 Fe
- Page 83 and 84:
Ordinary Meeting of Council - 27 Fe
- Page 85 and 86:
Ordinary Meeting of Council - 27 Fe
- Page 87 and 88:
Ordinary Meeting of Council - 27 Fe
- Page 89 and 90:
Ordinary Meeting of Council - 27 Fe
- Page 91 and 92:
Ordinary Meeting of Council - 27 Fe
- Page 116 and 117:
Ordinary Meeting of Council - 27 Fe
- Page 118 and 119:
Ordinary Meeting of Council - 27 Fe
- Page 120 and 121:
Contents Page Part 1 Introduction 1
- Page 122 and 123: • Participation, equity and acces
- Page 124 and 125: (4) Within 28 days after adopting a
- Page 126 and 127: Part 2 PAYMENT OF EXPENSES GENERAL
- Page 128 and 129: Where applicable the standard of an
- Page 130 and 131: Council shall meet the following co
- Page 132 and 133: Travel Outside the Local Government
- Page 134 and 135: Legal Expenses and Obligations 2.11
- Page 136 and 137: Part 3 PROVISION OF FACILITIES GENE
- Page 138 and 139: Meals and Refreshments Prior to or
- Page 140 and 141: ADDITIONAL EQUIPMENT AND FACILITIES
- Page 142 and 143: Part 4 OTHER MATTERS Acquisition an
- Page 144 and 145: Ordinary Meeting of Council - 27 Fe
- Page 146 and 147: Ordinary Meeting of Council - 27 Fe
- Page 148 and 149: Ordinary Meeting of Council - 27 Fe
- Page 150 and 151: Ordinary Meeting of Council - 27 Fe
- Page 152 and 153: Ordinary Meeting of Council - 27 Fe
- Page 154 and 155: Ordinary Meeting of Council - 27 Fe
- Page 156 and 157: Ku-ring-gai Council Comparative Inf
- Page 158 and 159: Below is a summary of the aims and
- Page 160 and 161: • Domestic Waste per capita The p
- Page 162 and 163: Average Rate per Residential Assess
- Page 164 and 165: Outstanding Rates, Charges and Fees
- Page 166 and 167: Reliance on Rates Revenue Reliance
- Page 168 and 169: Dissection of Operating Expenses Th
- Page 170 and 171: Total Operating Expenses (per capit
- Page 174 and 175: Library Operating Expenses This ind
- Page 176 and 177: Average Charge for Domestic Waste M
- Page 178 and 179: Recyclables - Kilograms (per capita
- Page 180 and 181: Number of Development Applications
- Page 182 and 183: Legal Expenses to Total Planning an
- Page 184 and 185: Net Recreation and Leisure Expenses
- Page 186 and 187: N S W DEPARTMENT OF LOCAL GOVERNMEN
- Page 188 and 189: Average Rate per Residential Assess
- Page 190 and 191: Total Operating Revenue (per capita
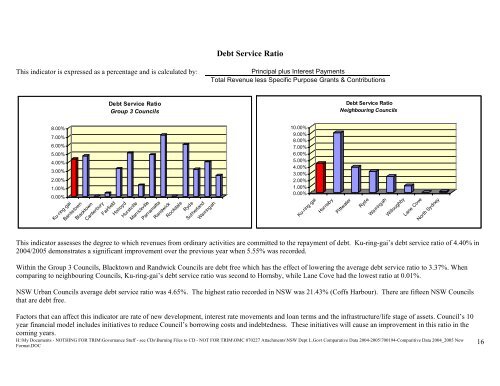
- Page 192 and 193: Debt Service Ratio 9.00% 8.00% 7.00
- Page 194 and 195: Average Domestic Waste charge per R
- Page 196 and 197: Number of Development Applications
- Page 198 and 199: Net Recreation & Leisure Expenses (
- Page 200 and 201: Ordinary Meeting of Council - 27 Fe
- Page 202 and 203: Ordinary Meeting of Council - 27 Fe
- Page 204 and 205: Ordinary Meeting of Council - 27 Fe
- Page 206 and 207: No Date Lodged Appeal # Appellant P
- Page 208 and 209: Subdivision 1 December 14, 2004 115
- Page 210 and 211: Ordinary Meeting of Council - 27 Fe
- Page 212 and 213: Ordinary Meeting of Council - 27 Fe
- Page 214 and 215: 2 The substation is listed on the S
- Page 217 and 218: Ordinary Meeting of Council - 27 Fe
- Page 219 and 220: Ordinary Meeting of Council - 27 Fe
- Page 221: Ku-ring-gai Local Environmental Pla
- Page 226 and 227:
Ordinary Meeting of Council - 27 Fe
- Page 228:
Ordinary Meeting of Council - 27 Fe
- Page 232 and 233:
Ordinary Meeting of Council - 27 Fe
- Page 234 and 235:
Ordinary Meeting of Council - 27 Fe
- Page 236 and 237:
1 3 28 3 5 7 22 20 35 33 D PROPOSED
- Page 238 and 239:
From: Keiron Jeanes [mailto:jean1ke
- Page 240 and 241:
Ordinary Meeting of Council - 27 Fe
- Page 242 and 243:
Ordinary Meeting of Council - 27 Fe
- Page 244 and 245:
Ordinary Meeting of Council - 27 Fe
- Page 246 and 247:
Ordinary Meeting of Council - 27 Fe
- Page 248 and 249:
Ordinary Meeting of Council - 27 Fe
- Page 278 and 279:
Ordinary Meeting of Council - 27 Fe
- Page 280 and 281:
Ordinary Meeting of Council - 27 Fe
- Page 282 and 283:
Ordinary Meeting of Council - 27 Fe
- Page 284 and 285:
Ordinary Meeting of Council - 27 Fe
- Page 286 and 287:
Ordinary Meeting of Council - 27 Fe
- Page 288 and 289:
Appendix A: Summary Review Summary
- Page 290 and 291:
Department: COMMUNITY SERVICES CC R
- Page 292 and 293:
Department: PLANNING & ENVIRONMENT
- Page 294 and 295:
Department: TECHNICAL SERVICES CC R
- Page 296 and 297:
Department: FINANCE & BUSINESS CC R
- Page 298 and 299:
Department: FINANCE & BUSINESS CC R
- Page 300 and 301:
Department: DEVELOPMENT & REGULATIO
- Page 302:
Department: CAPITAL WORKS PN RC Tas
- Page 375 and 376:
Ordinary Meeting of Council - 27 Fe