27 February 2007 - Ordinary Meeting of Council (pdf. 14MB)
27 February 2007 - Ordinary Meeting of Council (pdf. 14MB)
27 February 2007 - Ordinary Meeting of Council (pdf. 14MB)

Create successful ePaper yourself
Turn your PDF publications into a flip-book with our unique Google optimized e-Paper software.
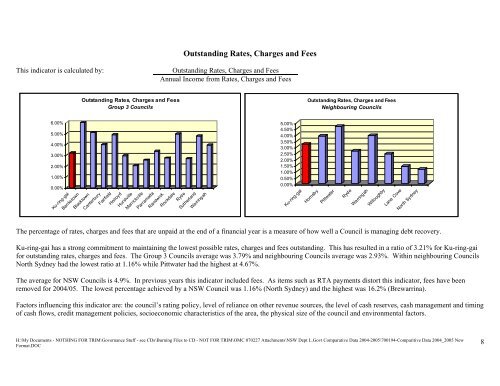
Outstanding Rates, Charges and Fees<br />
This indicator is calculated by:<br />
Outstanding Rates, Charges and Fees<br />
Annual Income from Rates, Charges and Fees<br />
Outstanding Rates, Charges and Fees<br />
Group 3 <strong>Council</strong>s<br />
Outstanding Rates, Charges and Fees<br />
Neighbouring <strong>Council</strong>s<br />
6.00%<br />
5.00%<br />
4.00%<br />
3.00%<br />
2.00%<br />
1.00%<br />
0.00%<br />
Ku-ring-gai<br />
Bankstown<br />
Blacktown<br />
Canterbury<br />
Fairfield<br />
Holroyd<br />
Hurstville<br />
Marrickville<br />
Parramatta<br />
Randwick<br />
Rockdale<br />
Ryde<br />
Sutherland<br />
Warringah<br />
The percentage <strong>of</strong> rates, charges and fees that are unpaid at the end <strong>of</strong> a financial year is a measure <strong>of</strong> how well a <strong>Council</strong> is managing debt recovery.<br />
Ku-ring-gai has a strong commitment to maintaining the lowest possible rates, charges and fees outstanding. This has resulted in a ratio <strong>of</strong> 3.21% for Ku-ring-gai<br />
for outstanding rates, charges and fees. The Group 3 <strong>Council</strong>s average was 3.79% and neighbouring <strong>Council</strong>s average was 2.93%. Within neighbouring <strong>Council</strong>s<br />
North Sydney had the lowest ratio at 1.16% while Pittwater had the highest at 4.67%.<br />
The average for NSW <strong>Council</strong>s is 4.9%. In previous years this indicator included fees. As items such as RTA payments distort this indicator, fees have been<br />
removed for 2004/05. The lowest percentage achieved by a NSW <strong>Council</strong> was 1.16% (North Sydney) and the highest was 16.2% (Brewarrina).<br />
Factors influencing this indicator are: the council’s rating policy, level <strong>of</strong> reliance on other revenue sources, the level <strong>of</strong> cash reserves, cash management and timing<br />
<strong>of</strong> cash flows, credit management policies, socioeconomic characteristics <strong>of</strong> the area, the physical size <strong>of</strong> the council and environmental factors.<br />
5.00%<br />
4.50%<br />
4.00%<br />
3.50%<br />
3.00%<br />
2.50%<br />
2.00%<br />
1.50%<br />
1.00%<br />
0.50%<br />
0.00%<br />
Ku-ring-gai<br />
Hornsby<br />
Pittwater<br />
Ryde<br />
Warringah<br />
Willoughby<br />
Lane Cove<br />
North Sydney<br />
H:\My Documents - NOTHING FOR TRIM\Governance Stuff - see CDs\Burning Files to CD - NOT FOR TRIM\OMC 0702<strong>27</strong> Attachments\NSW Dept L.Govt Comparative Data 2004-2005\700194-Comparitive Data 2004_2005 New<br />
Format.DOC<br />
8