- Page 1 and 2:
45 th Annual Conference of the Inte
- Page 3 and 4:
ii A11. Krouse, S.L., and Irvine, J
- Page 5 and 6:
iv OCCUPATIONAL ANALYSIS APPLIED FO
- Page 7 and 8:
vi ANALYTICS C09a. Heffner, T.S.; T
- Page 9 and 10:
viii NATIONAL DEFENCE FORCE (S.A.N.
- Page 11 and 12:
x Minutes International Military Te
- Page 13 and 14:
xii BY-LAWS OF THE INTERNATIONAL MI
- Page 15 and 16:
xiv coordinating Primary Member. An
- Page 17 and 18:
USABILITY TESTING: LESSONS LEARNED
- Page 19 and 20:
the operational environment and, of
- Page 21 and 22:
Pill, J. (1970) “The Delphi Metho
- Page 23 and 24:
Types of definition There are diffe
- Page 25 and 26:
they may discuss components of it.
- Page 27 and 28:
It seems that in the absence of uni
- Page 29 and 30:
Do we assess what we want to assess
- Page 31 and 32:
Construct and criterion related val
- Page 33 and 34:
Results Due to the lack of a normal
- Page 35 and 36:
during ACABO. The question was ther
- Page 37 and 38:
Scholz, G. S., H. (1993). Das nomol
- Page 39 and 40:
There are not many studies with the
- Page 41 and 42:
6 Neuroticism 4.53 .56 .71 -.25 -.1
- Page 43 and 44:
-.37** Neuroticism -.38** Extravers
- Page 45 and 46:
Judge, T.A., Bono, J.E., & Locke, E
- Page 47 and 48:
y members of the occupational field
- Page 49 and 50:
performance value to lowest through
- Page 51 and 52:
comparing the two products; perhaps
- Page 53:
TP Questionnaire AFSC _____________
- Page 56 and 57:
40 Attachment 4 Respondent Comments
- Page 58:
42 References Institute for Job and
- Page 61 and 62:
• Austria also has committed itse
- Page 63 and 64:
INTERNATIONAL OPERATIONS FORCES ENT
- Page 65 and 66:
JOB-SPECIFIC PERSONALITY ATTRIBUTES
- Page 67 and 68:
Canadian Forces. Results indicated
- Page 69 and 70:
Table 1. The NCOPI Dimensions and G
- Page 71 and 72:
Table 2. Correlations Between Perso
- Page 73 and 74:
To examine the relationship between
- Page 75 and 76:
correlates of psychological well-be
- Page 77 and 78:
Thomas, J. L., Dickson, M. W., & Bl
- Page 79 and 80:
more counterproductive behaviors, a
- Page 81 and 82:
dimension (e.g., maintain mechanica
- Page 83 and 84:
judged by trained raters). The resu
- Page 85 and 86:
Lightfoot, M.A., Alley, W.E., Schul
- Page 87 and 88:
abnormal positions such as spins an
- Page 89 and 90:
Description of OZ -----------------
- Page 91 and 92:
-----------------------------------
- Page 93 and 94:
-----------------------------------
- Page 95 and 96:
Procedure: Data collection consiste
- Page 97 and 98:
Fig. 4b: Heading performance of the
- Page 99 and 100:
Fig. 5b: Heading performance of the
- Page 101 and 102:
Fig. 6a: Altitude performance of th
- Page 103 and 104:
Discussion The most important concl
- Page 105 and 106:
12. Hoffman, R. R., Ford, K. M., an
- Page 107 and 108:
PERCEPTUAL DRIFT RELATED TO SPATIAL
- Page 109 and 110:
indicated by the negative values. T
- Page 111 and 112:
Dizio, P., Li, W., Lackner, J.R. &
- Page 113 and 114:
Psychologically, the victim of perc
- Page 115 and 116:
Individualized colored filters seem
- Page 117 and 118:
e remembered, however, that Irlen o
- Page 119 and 120:
Neurofeedback Training for Two Dime
- Page 121 and 122:
conserved. We can determine both Co
- Page 123 and 124:
sophisticated equipment and technol
- Page 125 and 126:
Figure 1: Changes in Concentration
- Page 127 and 128:
WHAT TODAY’S SOLDIERS TELL US ABO
- Page 129 and 130:
troubleshoot interconnectivity prob
- Page 131 and 132:
What advantages do Soldiers rate as
- Page 133 and 134:
This new training process viewed th
- Page 135 and 136:
collection and analysis. Also inclu
- Page 137 and 138:
CONCLUSION Figure 4: Sample Distrib
- Page 139 and 140:
RACE AND GENDER AS FACTORS IN FLIGH
- Page 141 and 142:
egression equation. The process was
- Page 143 and 144:
DISCUSSION These studies found that
- Page 145 and 146:
Validation of an Unmanned Aerial Ve
- Page 147 and 148:
direction, and stick movement produ
- Page 149 and 150:
References Biggerstaff, S., Blower,
- Page 151 and 152:
Table 2. Correlations and descripti
- Page 153 and 154:
Figure 1. Stick, rudder, and thrott
- Page 155 and 156:
Figure 3. Scatterplot of index scor
- Page 157 and 158:
The application of new information
- Page 159 and 160:
Communication. Recent research has
- Page 161 and 162:
of situation in which Soldiers woul
- Page 163 and 164:
An analysis of variance was perform
- Page 165 and 166:
Hevel, J. R. (2002). The Objective
- Page 167 and 168:
affective (or attitudinal) componen
- Page 169 and 170:
e1 e2 e3 Q53K .36 e4 e5 Q53I Q53J .
- Page 171 and 172:
REFERENCES Allen, N. J., & Meyer, J
- Page 173 and 174:
Rumsey, M.G. (1995). The best they
- Page 175 and 176:
(1999) found that among members in
- Page 177 and 178:
Results Satisfaction with the Milit
- Page 179 and 180:
Spouse/significant other support to
- Page 181 and 182:
quality of life in the Air Force, a
- Page 183 and 184:
BRITISH ARMY LEAVERS SURVEY: AN INV
- Page 185 and 186:
would be better, and that there wou
- Page 187 and 188:
ABSTRACT PREDICTORS OF U.S. ARMY CA
- Page 189 and 190:
Survey items were then aggregated i
- Page 191 and 192:
expects them to be committed, they
- Page 193 and 194:
THE IMPORTANCE OF A FAMILY-FRIENDLY
- Page 195 and 196:
multiple life roles (Kahn, Wolfe, Q
- Page 197 and 198:
consequently feel they are unable t
- Page 199 and 200:
perceptions of the usability of wor
- Page 201 and 202:
family-friendly work environment pe
- Page 203 and 204:
Previous studies have found that on
- Page 205 and 206:
For both employees with high family
- Page 207 and 208:
Figure 3 Interaction between FFWE,
- Page 209 and 210:
differently in the military compare
- Page 211 and 212:
Castro, C. A., Adler, A. B., & Bien
- Page 213 and 214:
Kossek, E. E., & Lobel, S. (1996).
- Page 215 and 216:
Tracking U.S. Navy Reserve Career D
- Page 217 and 218:
menus, a commander or career counse
- Page 219 and 220:
Respondents were divided in their r
- Page 221 and 222:
Duties and Functions of a Recruitin
- Page 223 and 224:
The in-house coaching provided to s
- Page 225 and 226:
Metrics of Unprofessional, Gender-R
- Page 227 and 228:
Regardless of paygrade, both women
- Page 229 and 230:
military installation. However, wom
- Page 231 and 232:
Table 6 Frequency of Reporting Beha
- Page 233 and 234:
action was taken against the offend
- Page 235 and 236:
Workplace Reprisals: A Model of Ret
- Page 237 and 238:
INCIDENCE OF RETALIATION Studies de
- Page 239 and 240:
Far less is known about the consequ
- Page 241 and 242:
METHOD Participants and Procedure T
- Page 243 and 244:
Subjective Appraisal The subjective
- Page 245 and 246:
RESULTS Exploratory Model The range
- Page 247 and 248:
More frequent occurrences of UGRB,
- Page 249 and 250:
organizational commitment and psych
- Page 251 and 252:
Fitzgerald, L.F., Drasgow, F., Huli
- Page 253 and 254:
UNDERSTANDING RESPONSES TO SEXUAL H
- Page 255 and 256:
sample population was selected thro
- Page 257 and 258:
Finally individuals were identified
- Page 259 and 260:
less likely to indicate they had ex
- Page 261 and 262:
● Non-Reporters < Reporters Figur
- Page 263 and 264:
eport (Other). Items endorsed in bo
- Page 265 and 266:
policy and procedure relevant to ha
- Page 267 and 268:
Justice Versus Gender Socialization
- Page 269 and 270:
Table of Contents Table of Contents
- Page 271 and 272:
1.1 Purpose 1.0 Introduction This p
- Page 273 and 274:
The Department of National Defence
- Page 275 and 276:
2.1 Stakeholder Brainstorming The f
- Page 277 and 278: 2.2 Stakeholder Influence and Impor
- Page 279 and 280: Figure 3 graphically represents sta
- Page 281 and 282: The SIS is a ‘research process ma
- Page 283 and 284: 3.2.1 The SIS Online As already men
- Page 285 and 286: stakeholder groups. Furthermore, th
- Page 287 and 288: INTRODUCTION DESIGNING A NEW HR SYS
- Page 289 and 290: homogeneity of work activities with
- Page 291 and 292: empirical information from the work
- Page 293 and 294: eviewed by NIMA management and othe
- Page 295 and 296: Observations made as a result of a
- Page 297 and 298: 45 th 3. Generating the specific qu
- Page 299 and 300: Strategies for Increased Reporting
- Page 301 and 302: of information technology systems.
- Page 303 and 304: Guide for Reporting Counterintellig
- Page 305 and 306: CHARACTERIZING INFORMATION SYSTEMS
- Page 307 and 308: In about 60% of these recorded even
- Page 309 and 310: following example, however, a cadet
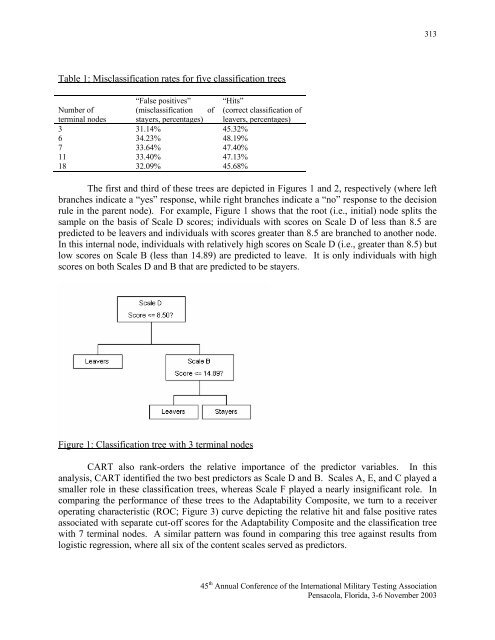
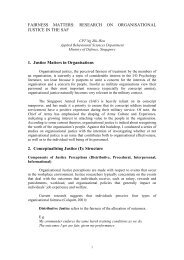
- Page 311 and 312: The most significant event of this
- Page 313 and 314: Ten Technological, Social, and Econ
- Page 315 and 316: can provide motivation and opportun
- Page 317 and 318: Requirement Inspection of MASS ques
- Page 319 and 320: Finally, third level questions woul
- Page 321 and 322: OCCUPATIONAL ANALYSIS APPLIED FOR T
- Page 323 and 324: CLASSIFICATION OF DUTIES INTO NEW S
- Page 325 and 326: CONCLUSIONS The procedure described
- Page 327: For each of the 27 items, the respo
- Page 331 and 332: y examining all of the possible cos
- Page 333 and 334: PREDICTING ATTRITION OF ARMY RECRUI
- Page 335 and 336: 1 1 P( vi = jθ = t) = − , 1+ exp
- Page 337 and 338: It can be seen that for this AIM sc
- Page 339 and 340: A NEW APPROACH TO CONSTRUCTING AND
- Page 341 and 342: stimulus t, and is considered a pos
- Page 343 and 344: items involving stimuli on dimensio
- Page 345 and 346: Roberts, J. S., Donoghue, J. R., &
- Page 347 and 348: viewed as a combination of two to t
- Page 349 and 350: e1 e2 e3 Q53K .36 e4 e5 Q53I Q53J .
- Page 351 and 352: REFERENCES Allen, N. J., & Meyer, J
- Page 353 and 354: impossible for people to hide their
- Page 355 and 356: Nederhof .52 ( 2003) 13 items 16 .7
- Page 357 and 358: The relationship between behaviour
- Page 359 and 360: However, possibilities are seen to
- Page 361 and 362: Article structure This paper descri
- Page 363 and 364: Figure 1. Simplified version of the
- Page 365 and 366: - My home front is proud of me. - M
- Page 367 and 368: Organizational aspects Appreciation
- Page 369 and 370: PRACTICAL APPLICATION OF THE DUTCH
- Page 371 and 372: efore reporting the results. b) Alt
- Page 373 and 374: LITERATURE Avenarius, M.J.H. (1994)
- Page 375 and 376: In particular it was identified tha
- Page 377 and 378: number of items to decrease the len
- Page 379 and 380:
A randomly selected sample of 1,500
- Page 381 and 382:
• When total wellbeing scores wer
- Page 383 and 384:
significantly better recruits for a
- Page 385 and 386:
• Non-zero Payoff: The number of
- Page 387 and 388:
The ordinates indicate the average
- Page 389 and 390:
In next- rather busy - graph the av
- Page 391 and 392:
vacancies. In fact, the problem of
- Page 393 and 394:
• Lescrève, F., The Selection of
- Page 395 and 396:
Vacancies per trade (Columns) for e
- Page 397 and 398:
From Attraction to Rejection: A Qua
- Page 399 and 400:
Saks, & Summers, 1991). Bretz and J
- Page 401 and 402:
suggest that applicants ‘rule out
- Page 403 and 404:
information he/she had received, (c
- Page 405 and 406:
is not uncommon that applicants nee
- Page 407 and 408:
the primary motive for withdrawal.
- Page 409 and 410:
References Anderson, N., Born, M.,
- Page 411 and 412:
Noe, R.A., Steffy, B.D., & Barber,
- Page 413 and 414:
Wanous, J.P. (1992). Organizational
- Page 415 and 416:
We also have under way a predictive
- Page 417 and 418:
For the validation analyses, a fina
- Page 419 and 420:
NLSI IMPLEMENTATION TO A WEB-BASED
- Page 421 and 422:
work at the sentence level. This am
- Page 423 and 424:
The semantic module: MRS and LKB Th
- Page 425 and 426:
Next the program has to deal with
- Page 427 and 428:
Conclusion Communication abilities
- Page 429 and 430:
Exam Center to work with the projec
- Page 431 and 432:
exam. Gateway was able to provide t
- Page 433 and 434:
questions is monitored statisticall
- Page 435 and 436:
3. Computerized testing has been sh
- Page 437 and 438:
3. Most publishers have chosen not
- Page 439 and 440:
should not house permanent cookies
- Page 441 and 442:
Figure 2. Five process model per in
- Page 443 and 444:
Results As of October 2003, the TSA
- Page 445 and 446:
Klion, R., Pfenninger, D., Chiocchi
- Page 447 and 448:
STREAMLINING OF THE NAVY ENLISTED A
- Page 449 and 450:
and compared with the number found
- Page 451 and 452:
March 2002 marked the implementatio
- Page 453 and 454:
Due to the limited bandwidth restri
- Page 455 and 456:
their tests. However, job seekers o
- Page 457 and 458:
they may already have in relation t
- Page 459 and 460:
way both in and out of school. A si
- Page 461 and 462:
The students were asked about their
- Page 463 and 464:
This work was funded by the Human S
- Page 465 and 466:
AIR’s past experienced in the IC
- Page 467 and 468:
obtain the necessary clearances nec
- Page 469 and 470:
As we move forward with integrating
- Page 471 and 472:
ENCAPS - Using Non-Cognitive Measur
- Page 473 and 474:
cognitive ability. One particularly
- Page 475 and 476:
classification of enlisted personne
- Page 477 and 478:
Abstract Pilot Selection in the Aus
- Page 479 and 480:
Royal Australian Navy (RAN) and Roy
- Page 481 and 482:
comprising the ATB pilot index (PI)
- Page 483 and 484:
References Bongers, S., and Pei, J.
- Page 485 and 486:
The Armed Services Vocational Aptit
- Page 487 and 488:
Attachment A Career Exploration Pro
- Page 489 and 490:
References Harmon, L. W., Hansen, J
- Page 491 and 492:
Watson, 2002; Dawis, 1991), or perh
- Page 493 and 494:
7 community interest elements, and
- Page 495 and 496:
Figure 3. Illustration of possible
- Page 497 and 498:
Vocational Interest Measurement in
- Page 499 and 500:
Usability Testing II The second pha
- Page 501 and 502:
THE ARMY VOCATIONAL INTEREST CAREER
- Page 503 and 504:
soldiers who left the Army for avoi
- Page 505 and 506:
the cross-validation sample. Since
- Page 507 and 508:
DEVELOPING MEASURES OF OCCUPATIONAL
- Page 509 and 510:
For Select21 we conceived of a nove
- Page 511 and 512:
1998). For example, nearly all of t
- Page 513 and 514:
potential benefit of including such
- Page 515 and 516:
OCCUPATIONAL SURVEY SUPPORT OF AIR
- Page 517 and 518:
tasks. The structure of jobs within
- Page 519 and 520:
AFSC 2A3X1 (A-10, F-15, U-2 AVIONIC
- Page 521 and 522:
Occupational Analytics Paul L. Jone
- Page 523 and 524:
Anticipating the Future for First-T
- Page 525 and 526:
now exist. Therefore, we had to der
- Page 527 and 528:
perhaps deserves note. This is the
- Page 529 and 530:
Sager, C. E., Russell, T. L., Campb
- Page 531 and 532:
The primary goal of selection/class
- Page 533 and 534:
Knowledges, Skills, and Attributes
- Page 535 and 536:
of anticipated future conditions ap
- Page 537 and 538:
REFERENCES Campbell, J. P., & Knapp
- Page 539 and 540:
SMEs to think of Soldiers they supe
- Page 541 and 542:
on a rating, while others use the H
- Page 543 and 544:
fairly easy to identify first-level
- Page 545 and 546:
eviewers considered the currency of
- Page 547 and 548:
DEVELOPING OPERATIONAL PERSONALITY
- Page 549 and 550:
In this paper, we focus on two meas
- Page 551 and 552:
Here, we score only those statement
- Page 553 and 554:
understanding how applicants might
- Page 555 and 556:
Putka, D.J., Kilcullen, R. N., & Wh
- Page 557 and 558:
of personality. Second, the same re
- Page 559 and 560:
Table 1. Correlations between Civil
- Page 561 and 562:
The latent structure underlying the
- Page 563 and 564:
There are many ways to score a situ
- Page 565 and 566:
ASSESSING PERSON-ENVIRONMENT (P-E)
- Page 567 and 568:
To develop the ADI, we first identi
- Page 569 and 570:
Army to provide it, and a second wh
- Page 571 and 572:
APPENDIX Example Item from the Work
- Page 573 and 574:
To achieve wide-scale implementatio
- Page 575 and 576:
team leadership; concern for Soldie
- Page 577 and 578:
1 ST WATCH: ASSESSMENT OF COPING ST
- Page 579 and 580:
assess individuals’ personal valu
- Page 581 and 582:
eported being most likely to use th
- Page 583 and 584:
1 st WATCH: THE NAVY FIT SCALE Mart
- Page 585 and 586:
Surveys RTC Grad Survey. This quest
- Page 587 and 588:
Hypothesis 3 stated that recruits w
- Page 589 and 590:
USING RESULTS FROM ATTITUDE AND OPI
- Page 591 and 592:
Using Survey and Interview Data: An
- Page 593 and 594:
Conclusions and Recommendations Thi
- Page 595 and 596:
Table 2 Percent of officers and enl
- Page 597 and 598:
UTILIZING SURVEY RESULTS OF THE NAV
- Page 599 and 600:
assessed by the survey. This notion
- Page 601 and 602:
original sample providing them with
- Page 603 and 604:
THE U.S. ARMY'S PERSONNEL REPLACEME
- Page 605 and 606:
This policy was so strictly adhered
- Page 607 and 608:
The Army has over 180,000 soldiers
- Page 609 and 610:
Since 1990 a lot of work has been d
- Page 611 and 612:
Results The internal consistency of
- Page 613 and 614:
A F II Coordinat or F III Scout F I
- Page 615 and 616:
Abstract Mental Health Literacy in
- Page 617 and 618:
of self-treatments and of professio
- Page 619 and 620:
the number of items to decrease the
- Page 621 and 622:
• Gender - 87.6% males, 12.4% fem
- Page 623 and 624:
ADF 60 , and community drug use rat
- Page 625 and 626:
The survey was re-administered in t
- Page 627 and 628:
The perceived moral intensity scale
- Page 629 and 630:
organization has significant contro
- Page 631 and 632:
ADAPTING OCCUPATIONAL ANALYSIS METH
- Page 633 and 634:
are not improved for the long term,
- Page 635 and 636:
Gateworth, R.D., & Field,H.S. (1998
- Page 637 and 638:
Inevitably, new technology will be
- Page 639 and 640:
experimentation report. The structu
- Page 641 and 642:
esponsibilities involved in this po
- Page 643 and 644:
Comparison of Tasks and Knowledge D
- Page 645 and 646:
angle of approach to the target may
- Page 647 and 648:
Transformational Leadership: Relati
- Page 649 and 650:
concentrate their efforts on longer
- Page 651 and 652:
levels of analysis (e.g., Klein, Da
- Page 653 and 654:
soldiers constituted 39 combat team
- Page 655 and 656:
performance domains at the same lev
- Page 657 and 658:
performance was significantly stron
- Page 659 and 660:
The finding that transformational l
- Page 661 and 662:
A third limitation is the relativel
- Page 663 and 664:
Devine, D.J., Clayton, L.D., Philip
- Page 665 and 666:
Ostroff, C., & Schmitt, N. (1993).
- Page 667 and 668:
Table 1: Responses from 10 Subject
- Page 669 and 670:
Table 3: Regression for FFM on Tran
- Page 671 and 672:
comprehensive guide that the Army c
- Page 673 and 674:
FRAMEWORK COMPARISON: 1958; 1973; 1
- Page 675 and 676:
Our review of the evolution of the
- Page 677 and 678:
DEVELOPING APPROPRIATE METRICS FOR
- Page 679 and 680:
METHOD Participants Participants we
- Page 681 and 682:
RESULTS Results are broken out belo
- Page 683 and 684:
As depicted in Table 3, half of par
- Page 685 and 686:
Table 5. Second Choice Rating Forma
- Page 687 and 688:
SOFTWARE SUPPORT OF HUMAN PERFORMAN
- Page 689 and 690:
SOFTWARE SUPPORT A working model (p
- Page 691 and 692:
Figure 3, illustrates the prototype
- Page 693 and 694:
framework. Having completed the ver
- Page 695 and 696:
HOW MILITARY RESEARCH CAN IMPROVE T
- Page 697 and 698:
characteristics” - such as task c
- Page 699 and 700:
Team-Coordination Training Another
- Page 701 and 702:
Numerous lessons learned have come
- Page 703 and 704:
teamwork training: Evaluation resul
- Page 705 and 706:
participated in informal class exer
- Page 707 and 708:
slightly modified for the second wo
- Page 709 and 710:
As a result, we are currently devel
- Page 711 and 712:
It was not surprising that decoloni
- Page 713 and 714:
a conflict. The end of the cold war
- Page 715 and 716:
understanding. Also, when individua
- Page 717 and 718:
DEPARTMENT OF DEFENCE (1996). White
- Page 719 and 720:
. Screening and monitoring of perso
- Page 721 and 722:
The TSES-R is a 13 item scale of po
- Page 723 and 724:
Career Intention Prior to Deploymen
- Page 725 and 726:
d. The sample is based on peace ope
- Page 727 and 728:
comparing self- and subordinate des
- Page 729 and 730:
5 4 3 2 1 Figure 1 - Mean Perceptio
- Page 731 and 732:
0.9 0.7 0.5 0.3 0.1 -0.1 Figure 2 -
- Page 733 and 734:
adding another variable of individu
- Page 735 and 736:
REFERENCES Baranski, J.V., & Petrus
- Page 737 and 738:
Leadership Competencies: Are We All
- Page 739 and 740:
The purpose in establishing compete
- Page 741 and 742:
Army - influencing people - by prov
- Page 743 and 744:
Table 3 Leadership Competency Compo
- Page 745 and 746:
In answer to ‘are we all saying t
- Page 747 and 748:
Navy Decisiveness /Risk Management
- Page 749 and 750:
Marine Corps Leadership Principles
- Page 751 and 752:
All potential military recruits mus
- Page 753 and 754:
successful completion of basic lang
- Page 755 and 756:
investigate whether it or a similar
- Page 757 and 758:
• NEXT STEPS As a first priority,
- Page 759 and 760:
INTRODUCTION This study investigate
- Page 761 and 762:
Table 2. Summary Goodness of Fit in
- Page 763 and 764:
Analysis of the 18-item Scale DISCU
- Page 765 and 766:
Lim, B. (2001). The Structure and N
- Page 767 and 768:
NSmen’s training cycle last for t
- Page 769 and 770:
To test the robustness of the hypot
- Page 771 and 772:
Table 2.3. Scale Reliabilities and
- Page 773 and 774:
Figure 3: Model for Regulars *0.57
- Page 775 and 776:
REFERENCES Huxley, T. (2000). Defen
- Page 777 and 778:
Another important influence on our
- Page 779 and 780:
as a multidimensional construct. Ta
- Page 781 and 782:
Table 3 Intercorrelations Among Pro
- Page 783 and 784:
METHOD PARTICIPANTS The DEOCS had b
- Page 785 and 786:
There is a link between test constr
- Page 787 and 788:
Truhon, S. A. (1999). Updating the
- Page 789 and 790:
attitudes and behaviors observed an
- Page 791 and 792:
effective way to re-build survivors
- Page 793 and 794:
Reference List Bunker, K.A. (1997).
- Page 795 and 796:
VALIDATION OF THE BELGIAN MILITARY
- Page 797 and 798:
instructions, in order to make obse
- Page 799 and 800:
Interviews GFD dichotomous was regr
- Page 801 and 802:
784 INDEX OF AUTHORS Acromite, M. 7
- Page 803:
786 INDEX OF AUTHORS Waugh, G.W. 54