- Page 1 and 2:
INTERNATIONAL OLYMPIC ACADEMY 7 th
- Page 3 and 4:
EPHORIA OF THE INTERNATIONAL OLYMPI
- Page 5 and 6:
IOC COMMISSION FOR CULTURE AND OLYM
- Page 7 and 8:
FOREWORD Report on the IOA’s Spec
- Page 9:
Montenegro participated in the semi
- Page 13 and 14:
CULTURAL AND POLITICAL PARAMETERS O
- Page 15 and 16:
network was not developed and the c
- Page 17 and 18:
and the bronze (60 gr) medals award
- Page 19 and 20:
their competitors to prepare themse
- Page 21 and 22:
situation, which dragged Greece int
- Page 23 and 24:
e a cultural event for the city, th
- Page 25 and 26:
Yalouris, N., “The sacred areas o
- Page 27 and 28:
54 Vikelas D. - P. de Coubertin Let
- Page 29 and 30:
Festivals: From 776 BC to 395 AD, t
- Page 31 and 32:
The Cultural Programme in the Los A
- Page 33 and 34:
It presents the City of Athens as t
- Page 35 and 36:
The Department of Culture is puttin
- Page 37 and 38:
ATHENS THROUGH THE CAMPAIGN FOR THE
- Page 39 and 40:
The identification of the Greek peo
- Page 41 and 42:
encourages homogeneity and indiffer
- Page 43 and 44:
international media, in particular,
- Page 45 and 46:
eports and 12 pictures) personally
- Page 47 and 48:
BIBLIOGRAPHY • Burbank M., J. And
- Page 49 and 50:
COMPETITION AND PHYSICAL EDUCATION
- Page 51 and 52:
eings, on integrating all society,
- Page 53 and 54:
outinised procedures, parades, band
- Page 55 and 56:
sports programmes, and the social,
- Page 57 and 58:
THE CULTURAL INFLUENCE OF DEMETRIOS
- Page 59 and 60:
to Paris, the so-called "City of Li
- Page 61 and 62:
Nicopolis to Olympia", (which first
- Page 63 and 64:
particularities of states and peopl
- Page 65 and 66:
(Crawford, 2001). Therefore, it is
- Page 67 and 68:
Olympic movement engages, alone or
- Page 69 and 70:
“Regarding the development of you
- Page 71 and 72:
were initially restricted to French
- Page 73 and 74:
Take for example, the Olympic motto
- Page 75 and 76:
that the NOA of Malaysia has embark
- Page 77 and 78:
• Durry, Jean (1996) Pierre de Co
- Page 79 and 80:
diverse in nature. They are aimed a
- Page 81 and 82:
they may select one sculpture and o
- Page 83 and 84:
Educational themes of the National
- Page 85 and 86:
HIGHER EDUCATION NATIONAL SPORT ACA
- Page 87 and 88:
THE NATIONAL OLYMPIC ACADEMY OF CEN
- Page 89 and 90:
- To continue our action towards th
- Page 91 and 92:
2005, and if we have a good recepti
- Page 93 and 94:
• Olympic Truce • Cultural acti
- Page 95 and 96:
THE ECUADORIAN OLYMPIC ACADEMY Mrs
- Page 97 and 98:
is conscience among students regard
- Page 99 and 100:
November 20, 1991 President N. Fila
- Page 101 and 102:
National Olympic Academies of the B
- Page 103 and 104:
Kangasniemi (weightlifting 1968). T
- Page 105 and 106:
world champion in swimming) career
- Page 107 and 108:
Seminary in Grenoble following the
- Page 109 and 110:
every leap year!... But how was the
- Page 111 and 112:
ancient tradition. The original tit
- Page 113 and 114:
Then came the throwing game, the gr
- Page 115 and 116:
conscious of this fact and see it a
- Page 117 and 118:
� Level II: for the managers of t
- Page 119 and 120:
-121- Courses Regulation Secondly:
- Page 121 and 122:
To fulfil these aims, 2 projects ha
- Page 123 and 124:
THE ROLE OF PHYSICAL EDUCATION AND
- Page 125 and 126:
Cooperation, collaboration and comm
- Page 127 and 128:
Second stage: The values and charac
- Page 129 and 130:
delivering to the society, youngste
- Page 131 and 132:
conceptual and technological develo
- Page 133 and 134:
ACTIVITIES OF THE JAPAN OLYMPIC ACA
- Page 135 and 136:
OLYMPIC EDUCATION 2004 THE NETHERLA
- Page 137 and 138:
THE SLOVAK OLYMPIC ACADEMY Dr Zdenk
- Page 139 and 140:
BUILDING VALUES THROUGH OLYMPISM SR
- Page 141 and 142:
As the founder and Director, I enjo
- Page 143 and 144:
won the praise of all participants
- Page 145 and 146:
NATIONAL OLYMPIC COMMITTEE OF TURKE
- Page 147 and 148:
3. To reach 400.000 students in 3 y
- Page 149 and 150:
Each game, lasting about 45 seconds
- Page 151 and 152:
REPORT ON THE ACTIVITIES OF THE OLY
- Page 153 and 154:
3.2. A scientific conference devote
- Page 155 and 156:
8. Sport Veteran Movement 8.1. In t
- Page 157 and 158:
3. Colleges • 14 - 20 July, 2003
- Page 159 and 160:
HOA’s aim: - olympic schools to b
- Page 161 and 162:
• No, sport is not culture: - Spo
- Page 163 and 164:
demonstrate excellence in performan
- Page 165 and 166:
3. Make the message international a
- Page 167 and 168:
• Establish program for Olympic e
- Page 169 and 170:
Mr Ah-Tok CHUA (MAS) Director, NOA
- Page 171 and 172:
ARGENTINA Mr Juan Carlos URIBURU Pr
- Page 173 and 174:
DEMOCRATIC REPUBLIC OF THE CONGO Mr
- Page 175 and 176:
GERMANY Prof. Dr Helmut ALTENBERGER
- Page 177 and 178:
Ms Jung KOO Member, NOA of KOREA LA
- Page 179 and 180:
PERU Mr Rodolfo CREMER NICOLI Direc
- Page 181 and 182:
SLOVAKIA Mrs Zdenka LETENAYOVA Secr
- Page 183 and 184:
Mrs Larisa DOTSENKO OAU Scientific
- Page 185:
Ms Roula VATHI Thomaidou 1 115 25 N
- Page 189 and 190:
ARETÉ Ms Petra HRACHOVINOVA (CZE)
- Page 191 and 192:
many opportunities, for example, we
- Page 193 and 194:
the questions, in the dialogue betw
- Page 195 and 196:
4. ARETÉ as the whole in the concr
- Page 197 and 198:
VIRTUE AS A SPORT IN ANCIENT GREECE
- Page 199 and 200:
of paideia, which, according to Pla
- Page 201 and 202:
earn immortality through a laboriou
- Page 203 and 204:
origin of the winners were formed t
- Page 205 and 206:
NOTES 1 Hom. Il. 6, 208 (Hippolokho
- Page 207 and 208:
34 Diog. Laert. V 27. Among the man
- Page 209 and 210:
• KYLE, D.G., “Winning at Olymp
- Page 211 and 212:
πρώτος etc. (=the one and onl
- Page 213 and 214:
Koronia. Well-known are also the ac
- Page 215 and 216:
a temple or a shrine, an altar or a
- Page 217 and 218:
worship, between the Persian war (4
- Page 219 and 220:
THE OLYMPIC GAMES AND STATE FORMATI
- Page 221 and 222:
The Olympic victor and the polis: t
- Page 223 and 224:
In return, Olympic victors translat
- Page 225 and 226:
Macedon’s decisive victory over t
- Page 227 and 228:
KNOWLEDGE OF AND IDEAS ABOUT OLYMPI
- Page 229 and 230:
Geographical Sources PAUSANIAS was
- Page 231 and 232:
Pre-Olympic Games 17 Dating from th
- Page 233 and 234:
Excavations The first archaeologica
- Page 235 and 236:
situated. PAUSANIAS, Führer durch
- Page 237 and 238:
29 DOLIANITIS, Giorgios, “Die gri
- Page 239 and 240:
INTELLECTUAL PREMISES OF SPORT IN T
- Page 241 and 242:
the popular ones. From one of these
- Page 243 and 244:
way of life: "the chief support cam
- Page 245 and 246:
BOA’s aim is to promote the Olymp
- Page 247 and 248:
In France, in 1792, fourth year of
- Page 249 and 250:
Dimitrios Vikelas’ part in the Mo
- Page 251 and 252:
well-being but also to the formatio
- Page 253 and 254:
exceptionally enthusiastic crowd of
- Page 255 and 256:
15 Oikonomou A., Three people, p.p
- Page 257 and 258:
OLYMPIC GAMES AND AMATEURISM IN THE
- Page 259 and 260:
“I felt that the British would vo
- Page 261 and 262:
II. What is at stake when dealing w
- Page 263 and 264:
Surely this should indicate that as
- Page 265 and 266:
it holds out hope for a happier, he
- Page 267 and 268:
symbolic persons of this debate (Av
- Page 269 and 270:
5 SCHRANZ, Karl (Aufgezeichnet von
- Page 271 and 272:
30 DI RUZZA, F. ; GERBIER, B. (1977
- Page 273 and 274:
BIBLIOGRAPHY: • ALBERT, Pierre (1
- Page 275 and 276:
• MÜLLER, Norbert (1995) (coord.
- Page 277 and 278:
investment, in cash or kind, in an
- Page 279 and 280:
Table 1: TOP Programme Evolution (I
- Page 281 and 282:
Conclusion The Olympic marketing pr
- Page 283 and 284:
AN OLYMPIC INDEX: A COMPARISON OF P
- Page 285 and 286:
to win at each Olympic edition. Sin
- Page 287 and 288:
% Figure 2: Percentage of the total
- Page 289 and 290:
Based on the medal ranking, the Net
- Page 291 and 292:
THE OLYMPIC GAMES, EUGENICS, AND GE
- Page 293 and 294:
therapies could be used to artifici
- Page 295 and 296:
delivered to the working muscles wh
- Page 297 and 298:
under these broad and encompassing
- Page 299 and 300:
APPENDIX Gene Doping, Eugenics, and
- Page 301 and 302:
transfer techniques, then the anaem
- Page 303 and 304:
phenomenon from without. Therefore,
- Page 305 and 306:
It is interesting to hear that Torb
- Page 307 and 308:
and light all have a great importan
- Page 309 and 310:
How can we make this perception mor
- Page 311 and 312:
“WIND OF CHANGE IN THE ROUND TABL
- Page 313 and 314:
women participating in sport and ph
- Page 315 and 316:
Volleyball association regarding th
- Page 317 and 318:
Biographical methods carried a stro
- Page 319 and 320:
members of sport organization, Rath
- Page 321 and 322:
In this paper, we will focus on one
- Page 323 and 324:
instance I was a member without vot
- Page 325 and 326:
In order to gain more influential p
- Page 327 and 328:
However, after many following meeti
- Page 329 and 330:
Volleyball Board came up with an id
- Page 331 and 332:
BIBLIOGRAPHY • Bertaux, D. (1996)
- Page 333 and 334:
GLOBALIZATION AND INTERNATIONALIZAT
- Page 335 and 336:
The second account of globalization
- Page 337 and 338:
2.1 Sport as a ‘Globalized Cultur
- Page 339 and 340:
are also involved in the rapid expa
- Page 341 and 342:
and Sport for All through the regul
- Page 343 and 344:
of sport (www.wada-ama.org/en) 17 .
- Page 345 and 346:
NOTES 1 Some globalization skeptics
- Page 347 and 348:
18 Bruce Kidd and Peter Donnelly (2
- Page 349 and 350:
Distinctive features On politics On
- Page 351 and 352:
BIBLIOGRAPHY • Anderson, B. (1991
- Page 353 and 354:
• Henry, I. (1999) "Globalisation
- Page 355 and 356:
• Rosenau, J. N. (1990) Turbulenc
- Page 357 and 358:
conditions of the State of Californ
- Page 359 and 360:
Olympic sponsorship is a part of in
- Page 361 and 362:
Building business and trade relatio
- Page 363 and 364:
The Olympic Games The Olympic Games
- Page 365 and 366:
BIBLIOGRAPHY • MATTHEW D. SHANK (
- Page 367 and 368:
Olympic Congresses called during Co
- Page 369 and 370:
Throughout the more than forty year
- Page 371 and 372:
edition in 2003. Likewise, seven jo
- Page 373 and 374:
events including international comp
- Page 375 and 376:
expressed in the fundamentals princ
- Page 377 and 378:
� The IOA should: o Coordinate wi
- Page 379 and 380:
THE IMPLEMENTATION OF ETHICAL STAND
- Page 381 and 382:
(CACHAY/THIEL 1997, 11 ff; PATSANTA
- Page 383 and 384:
principles and whether there is a c
- Page 385 and 386:
While fairness (68.5%), - independe
- Page 387 and 388:
The principle of solidarity My COAC
- Page 389 and 390:
with an early high-performance age.
- Page 391 and 392:
BIBLIOGRAPHY • ABRAHAM, A.: Ident
- Page 393 and 394:
Introduction OLYMPIC EDUCATIONAL PR
- Page 395 and 396:
employment, it has guided all the i
- Page 397 and 398:
Not being social aware is a lack of
- Page 399 and 400:
take environmental considerations i
- Page 401 and 402:
policy. It is the first case in Ita
- Page 403 and 404:
Organisational Committee and valida
- Page 405 and 406:
SCHOOL OLYMPIC GAMES IN ESTONIA Oly
- Page 407 and 408:
� contest of the Olympic mascot;
- Page 409 and 410:
In mathematics younger students can
- Page 411 and 412:
Tõrva, founded in 1767, in 1996 on
- Page 413 and 414:
of Europe best wrestlers. Within cu
- Page 415 and 416:
ROLE OF OLYMPIC EDUCATION AT SCHOOL
- Page 417 and 418:
centralized management system, from
- Page 419 and 420:
independence. Compulsory and option
- Page 421 and 422:
The offered themes about ancient Ol
- Page 423 and 424:
The offered themes about ancient Ol
- Page 425 and 426:
Introduction REACHING SECONDARY SCH
- Page 427 and 428:
essential part of life and thus con
- Page 429 and 430:
Common barriers and constraints As
- Page 431 and 432:
Bridging National Olympic Academies
- Page 433 and 434:
tools and resources they need to te
- Page 435 and 436:
separate us very much.” This, in
- Page 437 and 438:
APPENDIX 1 - QUESTIONS ASKED IN QUE
- Page 439 and 440:
Table 3 - List of small island stat
- Page 441 and 442:
REFERENCES • BORG, L. (1996) Smal
- Page 443 and 444:
In May 2004, the Seventh School Oly
- Page 445 and 446:
8. Financing sports career and an a
- Page 447 and 448:
Introduction (Activity, Sport, Cult
- Page 449 and 450:
win or become a champion. The aim o
- Page 451 and 452:
Culture and Ethics in Symbols and P
- Page 453 and 454:
duty in life is not to win but to m
- Page 455 and 456:
athlete can’t use any means to wi
- Page 457 and 458:
emphasize the Cultural and Ethical
- Page 459 and 460:
value of good example and respect f
- Page 461 and 462:
status and winning, and therefore t
- Page 463 and 464:
Although there was increasing accep
- Page 465 and 466:
stretching our skills to meet the c
- Page 467 and 468:
to structure sport so that it is a
- Page 469 and 470:
• Miller, P. S. and Kerr, G. A. (
- Page 471 and 472:
The complexity and general aggravat
- Page 473 and 474:
explaining the variety of the forms
- Page 475 and 476:
2.3 Elite Sport System - How to Bre
- Page 477 and 478:
commercial sector thereby requires
- Page 479 and 480:
society, economy and government wit
- Page 481 and 482:
strong link between the government
- Page 483 and 484:
of competitors and best-in-class co
- Page 485 and 486:
• Houlihan, B., 1997. Sport, Poli
- Page 487 and 488:
jurisdictional task carried out in
- Page 489 and 490:
1.2.2. The Application for Arbitrat
- Page 491 and 492:
At this point the special features
- Page 493 and 494:
Conclusions The CAS Ad Hoc Division
- Page 495 and 496:
of the IAF Symposium on Sport & Law
- Page 497 and 498:
“WHAT’S THAT IT’S ALL ABOUT?
- Page 499 and 500:
• The independence of sport As Ki
- Page 501 and 502:
Scholars are divided in their asses
- Page 503 and 504:
codes of excellence were operationa
- Page 505 and 506:
of international understanding was
- Page 507 and 508:
to combine some of that” (Gold Ru
- Page 509 and 510:
WOMEN IN CHINESE SPORTS: ACHIEVEMEN
- Page 511 and 512:
THE DEVELOPMENT OF THE OLYMPIC MOVE
- Page 513 and 514:
Georgia is amongst those 30 countri
- Page 515 and 516:
From this point of view, the import
- Page 517 and 518: WOMEN’S PARTICIPATION IN THE NICA
- Page 519 and 520: Defrantz of United States of Americ
- Page 521 and 522: Executive and the Technical Secreta
- Page 523 and 524: are single mothers that drop school
- Page 525 and 526: there were 85 Nicaraguan women comp
- Page 527 and 528: Table 4 Nicaraguan Women’s Partic
- Page 529 and 530: Currently, there are in total 16 wo
- Page 531 and 532: BIBLIOGRAPHY Books and/or papers
- Page 533 and 534: MANAGEMENT OF SPORTS AND NIGERIA’
- Page 535 and 536: populace i.e. the tax payer expects
- Page 537 and 538: Ministry of Sport, all Ministers of
- Page 539 and 540: potentials in Nigeria, as reflected
- Page 541 and 542: 3. PROFESSIONAL PREPARATIONS OF SPO
- Page 543 and 544: DEALING WITH SOCIO-CULTURAL BARRIER
- Page 545 and 546: Black African female participation
- Page 547 and 548: In the present dispensation she is
- Page 549 and 550: gathered from a number of female do
- Page 551 and 552: REFERENCES • Adedeji, J.A. (1991)
- Page 553 and 554: - acceptance of rules and decisions
- Page 555 and 556: Together with fair play, we also ex
- Page 557 and 558: • Factor 6: Irresponsibility: rep
- Page 559 and 560: Regarding fair play both groups dif
- Page 561 and 562: asic, whereas older athletes also k
- Page 563 and 564: - Women Olympic sportswomen are mor
- Page 565 and 566: THE EFFECT OF VIDEO-MODELING ON PER
- Page 567: had investigated the effectiveness
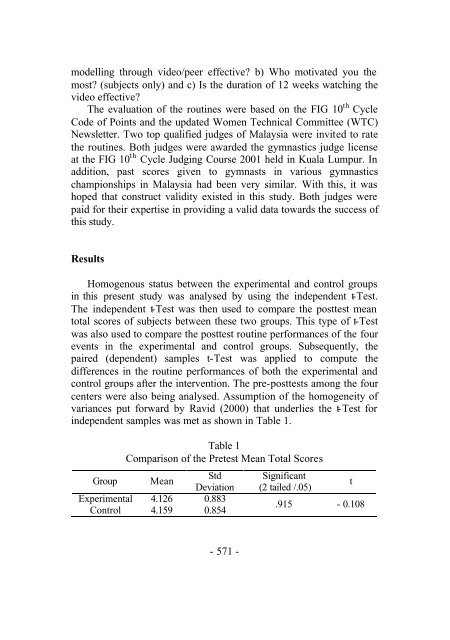
- Page 571 and 572: Nevertheless there existed a signif
- Page 573 and 574: Table 6 Pre-posttest of the Control
- Page 575 and 576: However there existed a significant
- Page 577 and 578: in learning the correct form in the
- Page 579 and 580: REFERENCES • Adams, D. (2001). Th
- Page 581 and 582: Abstract retrieved November 11, 200
- Page 583 and 584: implication in sport. The Internati
- Page 585 and 586: the Olympic Studies Centre. From th
- Page 587 and 588: The ISSEP was established in 1997 w
- Page 589 and 590: � Research (The EPFL is also the
- Page 591 and 592: � Promote the Olympic Movement to
- Page 593 and 594: � In a single place: one Professo
- Page 595 and 596: STRATEGIC CONSIDERATION FOR THE DEV
- Page 597 and 598: The Sport Directory The Sport Direc
- Page 599 and 600: every weekend starting from the 05
- Page 601 and 602: Support Group Appeal - refers to th
- Page 603 and 604: the good relationships between the
- Page 605 and 606: the identification of an organisati
- Page 607 and 608: 5. Installing more beach volleyball
- Page 609 and 610: • Longman (1988) ‘Dictionary of
- Page 611 and 612: STUDENTS’ PRESENTATIONS Four pape
- Page 613 and 614: girls in separate teams, under the
- Page 615 and 616: times but remained largely an arist
- Page 617 and 618: for improving society. The late nin
- Page 619 and 620:
on political issues, specifically t
- Page 621 and 622:
Another Games within the Olympic mo
- Page 623 and 624:
human springtime. While the initial
- Page 625 and 626:
protection with constant monitoring
- Page 627 and 628:
years after the respective events.
- Page 629 and 630:
D. CONCLUSIONS ON “ETHICAL AND PH
- Page 631 and 632:
marketability, attract sponsors, an
- Page 633 and 634:
Olympic philosophy between elitism
- Page 635 and 636:
Fifth, to operationalise the Olympi
- Page 637 and 638:
The Educational and Instructional M
- Page 639 and 640:
The Hungarian Olympic Academy Mrs M
- Page 641 and 642:
The Implementation of Ethical Stand
- Page 643:
Conclusions Conclusions on “Ancie