- Page 1 and 2:
HANDBOOK OF AIR CONDITIONING AND RE
- Page 3 and 4:
This book is dedicated to my dear w
- Page 5 and 6:
PREFACE TO SECOND EDITION Air condi
- Page 7 and 8:
ACKNOWLEDGMENTS PREFACE TO THE FIRS
- Page 9 and 10:
I.2 INDEX Air conditioning systems,
- Page 11 and 12:
I.4 INDEX Bernoulli equation, 17.2
- Page 13 and 14:
I.6 INDEX Chilled-water storage sys
- Page 15 and 16:
I.8 INDEX Constant-volume single-zo
- Page 17 and 18:
I.10 INDEX Discharge air temperatur
- Page 19 and 20:
I.12 INDEX Evaporative cooling syst
- Page 21 and 22:
I.14 INDEX Fault detection and diag
- Page 23 and 24:
I.16 INDEX Ice storage systems: com
- Page 25 and 26:
I.18 INDEX Packaged systems, fan-po
- Page 27 and 28:
I.20 INDEX Refrigerant flow control
- Page 29 and 30:
I.22 INDEX Silencers (Cont.) dissip
- Page 31 and 32:
I.24 INDEX Space pressurization or
- Page 33 and 34:
I.26 INDEX VAV systems, VAV cooling
- Page 35 and 36:
Preface to Second Edition xi Prefac
- Page 37 and 38:
Chapter 27. Air Conditioning System
- Page 39 and 40:
1.2 CHAPTER ONE limits for the comf
- Page 41 and 42:
1.4 CHAPTER ONE Individual Room Air
- Page 43 and 44:
1.6 CHAPTER ONE Unitary Packaged Ai
- Page 45 and 46:
1.8 CHAPTER ONE Water System Centra
- Page 47 and 48:
1.10 CHAPTER ONE fire protection sy
- Page 49 and 50:
1.12 CHAPTER ONE Unitary Packaged S
- Page 51 and 52:
1.14 CHAPTER ONE in the residential
- Page 53 and 54:
1.16 CHAPTER ONE shipments were 750
- Page 55 and 56:
1.18 CHAPTER ONE properly equipped
- Page 57 and 58:
1.20 CHAPTER ONE Engineer’s Quali
- Page 59 and 60:
1.22 CHAPTER ONE Drawings Specifica
- Page 61 and 62:
1.24 CHAPTER ONE criteria or system
- Page 63 and 64:
1.26 CHAPTER ONE ● Equipment sele
- Page 65 and 66:
1.28 CHAPTER ONE Rowland, F. S., Th
- Page 67 and 68:
2.2 CHAPTER TWO The amount of water
- Page 69 and 70:
2.4 CHAPTER TWO Dalton’s law is b
- Page 71 and 72:
2.6 CHAPTER TWO Temperature Measure
- Page 73 and 74:
2.8 CHAPTER TWO Degree of Saturatio
- Page 75 and 76:
2.10 CHAPTER TWO Density where pat
- Page 77 and 78:
2.12 CHAPTER TWO Thermodynamic Wet-
- Page 79 and 80:
2.14 CHAPTER TWO The term T � T
- Page 81 and 82:
2.16 CHAPTER TWO 2.8 HUMIDITY MEASU
- Page 83 and 84:
2.18 CHAPTER TWO FIGURE 2.7 Ion-exc
- Page 85 and 86:
2.20 CHAPTER TWO The last digit for
- Page 87 and 88:
2.22 CHAPTER TWO Cooling and Dehumi
- Page 89 and 90:
2.24 CHAPTER TWO p ws � From Eq.
- Page 91 and 92:
2.26 CHAPTER TWO Aslam, S., Charmch
- Page 93 and 94:
3.2 CHAPTER THREE 3.1 BUILDING ENVE
- Page 95 and 96:
3.4 CHAPTER THREE Convective Heat T
- Page 97 and 98:
3.6 CHAPTER THREE Overall Heat Tran
- Page 99 and 100:
3.8 CHAPTER THREE Heat Capacity The
- Page 101 and 102:
3.10 CHAPTER THREE Coefficients for
- Page 103 and 104:
3.12 CHAPTER THREE Temperature also
- Page 105 and 106:
3.14 CHAPTER THREE FIGURE 3.3 Mass
- Page 107 and 108:
3.16 CHAPTER THREE Moisture Transfe
- Page 109 and 110:
3.18 CHAPTER THREE During summer, t
- Page 111 and 112:
3.20 CHAPTER THREE TABLE 3.3 Therma
- Page 113 and 114:
3.22 CHAPTER THREE 3.7 SOLAR ANGLES
- Page 115 and 116:
3.24 CHAPTER THREE ● Solar altitu
- Page 117 and 118:
3.26 CHAPTER THREE In Table 3.5, th
- Page 119 and 120:
3.28 CHAPTER THREE National Climati
- Page 121 and 122:
3.30 CHAPTER THREE silver coatings
- Page 123 and 124:
3.32 CHAPTER THREE 3.10 HEAT ADMITT
- Page 125 and 126:
3.34 CHAPTER THREE design condition
- Page 127 and 128:
3.36 CHAPTER THREE Shading Coeffici
- Page 129 and 130:
3.38 CHAPTER THREE 40° north latit
- Page 131 and 132:
3.40 CHAPTER THREE and fire protect
- Page 133 and 134:
3.42 CHAPTER THREE External Shading
- Page 135 and 136:
3.44 CHAPTER THREE FIGURE 3.16 Shad
- Page 137 and 138:
3.46 CHAPTER THREE 3.12 HEAT EXCHAN
- Page 139 and 140:
3.48 CHAPTER THREE Example 3.2. At
- Page 141 and 142:
3.50 CHAPTER THREE Fenestration, in
- Page 143 and 144:
3.52 CHAPTER THREE Donnelly, R. G.,
- Page 145 and 146:
4.2 CHAPTER FOUR 2. Indoor air qual
- Page 147 and 148:
4.4 CHAPTER FOUR 4.3 METABOLIC RATE
- Page 149 and 150:
4.6 CHAPTER FOUR When the air veloc
- Page 151 and 152:
4.8 CHAPTER FOUR calculated as TABL
- Page 153 and 154:
4.10 CHAPTER FOUR FIGURE 4.2 Mean v
- Page 155 and 156:
4.12 CHAPTER FOUR FIGURE 4.4 Dimens
- Page 157 and 158:
4.14 CHAPTER FOUR Effective Tempera
- Page 159 and 160:
FIGURE 4.5 Fanger’s comfort chart
- Page 161 and 162:
4.18 CHAPTER FOUR Dew-point tempera
- Page 163 and 164:
4.20 CHAPTER FOUR lower boundary in
- Page 165 and 166:
4.22 CHAPTER FOUR FIGURE 4.9 Relati
- Page 167 and 168:
4.24 CHAPTER FOUR levels are as fol
- Page 169 and 170:
4.26 CHAPTER FOUR In Eq. (4.24), 0.
- Page 171 and 172:
4.28 CHAPTER FOUR 1. Total particul
- Page 173 and 174:
4.30 CHAPTER FOUR Outdoor Air Requi
- Page 175 and 176:
4.32 CHAPTER FOUR 4.12 SOUND LEVEL
- Page 177 and 178:
4.34 CHAPTER FOUR Human Response an
- Page 179 and 180:
4.36 CHAPTER FOUR FIGURE 4.11 Room
- Page 181 and 182:
4.38 CHAPTER FOUR hazardous, contam
- Page 183 and 184:
4.40 TABLE 4.10 Climatic Conditions
- Page 185 and 186:
4.42 CHAPTER FOUR 3. Outdoor weathe
- Page 187 and 188:
CHAPTER 5 ENERGY MANAGEMENT AND CON
- Page 189 and 190:
The 1973 energy crisis greatly boos
- Page 191 and 192:
The later the building is construct
- Page 193 and 194:
Control Methods ENERGY MANAGEMENT A
- Page 195 and 196:
5.3 CONTROL MODES Two-Position Cont
- Page 197 and 198:
Floating Control Proportional Contr
- Page 199 and 200:
The set point is the desired value
- Page 201 and 202:
where K is the derivative gain. The
- Page 203 and 204:
ENERGY MANAGEMENT AND CONTROL SYSTE
- Page 205 and 206:
Pressure Sensors Flow Sensors ENERG
- Page 207 and 208:
An infrared occupancy sensor senses
- Page 209 and 210:
For a direct-acting pneumatic tempe
- Page 211 and 212:
attery backup. However, EEPROM cann
- Page 213 and 214:
Types of Control Valves to the elec
- Page 215 and 216:
Valve Selection ENERGY MANAGEMENT A
- Page 217 and 218:
design water flow rate V˙ , gpm (L
- Page 219 and 220:
The movement of the split damper fr
- Page 221 and 222:
damper is then fully opened. If the
- Page 223 and 224:
Damper Selection Damper Sizing wher
- Page 225 and 226:
BAC net SC BAC net UC UC UC UC SC A
- Page 227 and 228:
Future Development The development
- Page 229 and 230:
Network Layer Conformance Class, Fu
- Page 231 and 232:
5.10 CONTROL LOGIC AND ARTIFICIAL I
- Page 233 and 234:
Fuzzy Logic Controller. An FLC cons
- Page 235 and 236:
give a printout. A friendly dialog
- Page 237 and 238:
Artificial Neural Networks ENERGY M
- Page 239 and 240:
3. Evaluate the error � between t
- Page 241 and 242:
Graphical Programming for Mechanica
- Page 243 and 244:
System Capacity changes during off-
- Page 245 and 246:
Generic Controls ENERGY MANAGEMENT
- Page 247 and 248:
● Central plant control Multiple-
- Page 249 and 250:
The diagnostician used color coding
- Page 251 and 252:
Discharge air temperature T dis,
- Page 253 and 254:
REFERENCES ENERGY MANAGEMENT AND CO
- Page 255 and 256:
ENERGY MANAGEMENT AND CONTROL SYSTE
- Page 257 and 258:
6.2 CHAPTER SIX 6.1 SPACE LOAD CHAR
- Page 259 and 260:
6.4 CHAPTER SIX FIGURE 6.2 Solar he
- Page 261 and 262:
6.6 CHAPTER SIX Influence of Stored
- Page 263 and 264:
6.8 CHAPTER SIX leaving the coil, s
- Page 265 and 266:
6.10 CHAPTER SIX the maximum sum of
- Page 267 and 268:
6.12 CHAPTER SIX adoption of person
- Page 269 and 270:
6.14 CHAPTER SIX Characteristics of
- Page 271 and 272:
6.16 CHAPTER SIX where T sol, a �
- Page 273 and 274:
6.18 CHAPTER SIX Space latent heat
- Page 275 and 276:
6.20 CHAPTER SIX FIGURE 6.7 Relatio
- Page 277 and 278:
6.22 TABLE 6.2 CLTD for Calculating
- Page 279 and 280:
6.24 CHAPTER SIX Infiltration Infil
- Page 281 and 282:
6.26 CHAPTER SIX nighttime in summe
- Page 283 and 284:
6.28 CHAPTER SIX ● Outer surface
- Page 285 and 286:
6.30 TABLE 6.6 July Solar Cooling L
- Page 287 and 288:
6.32 CHAPTER SIX From Eqs. (6.19a)
- Page 289 and 290:
6.34 CHAPTER SIX thickness of the d
- Page 291 and 292:
6.36 CHAPTER SIX Simplifying Assump
- Page 293 and 294:
6.38 CHAPTER SIX where hci � conv
- Page 295 and 296:
6.40 CHAPTER SIX Adjacent Unheated
- Page 297 and 298:
6.42 CHAPTER SIX the next morning b
- Page 299 and 300:
6.44 CHAPTER SIX Trace 600 Input—
- Page 301 and 302:
6.46 CHAPTER SIX ● For the calcul
- Page 303 and 304:
6.48 CHAPTER SIX Area of perimeter
- Page 305 and 306:
6.50 CHAPTER SIX Komor, P., Space C
- Page 307 and 308:
7.2 CHAPTER SEVEN 7.1 FUNDAMENTALS
- Page 309 and 310:
7.4 CHAPTER SEVEN Open systems need
- Page 311 and 312:
7.6 CHAPTER SEVEN FIGURE 7.2 Fricti
- Page 313 and 314:
7.8 TABLE 7.1 Dimensions of Commonl
- Page 315 and 316:
TABLE 7.2 Dimensions of Copper Tube
- Page 317 and 318:
7.12 CHAPTER SEVEN Pipe Joints Copp
- Page 319 and 320:
7.14 CHAPTER SEVEN also be consider
- Page 321 and 322:
7.16 CHAPTER SEVEN Insulation expos
- Page 323 and 324:
7.18 CHAPTER SEVEN Valve Materials
- Page 325 and 326:
7.20 CHAPTER SEVEN Open Expansion T
- Page 327 and 328:
7.22 CHAPTER SEVEN FIGURE 7.8 Close
- Page 329 and 330:
7.24 CHAPTER SEVEN Penalties due to
- Page 331 and 332:
7.26 CHAPTER SEVEN TABLE 7.7 Analys
- Page 333 and 334:
7.28 CHAPTER SEVEN Changeover Two P
- Page 335 and 336:
7.30 CHAPTER SEVEN a semiautomatic
- Page 337 and 338:
7.32 CHAPTER SEVEN Performance Curv
- Page 339 and 340:
7.34 CHAPTER SEVEN remove. In most
- Page 341 and 342:
7.36 CHAPTER SEVEN FIGURE 7.15 Comb
- Page 343 and 344:
7.38 CHAPTER SEVEN The wire-to-wate
- Page 345 and 346:
7.40 CHAPTER SEVEN Variable Flow fo
- Page 347 and 348:
7.42 CHAPTER SEVEN Chiller VSD 2 VS
- Page 349 and 350:
7.44 5 2 6 Plant hot water pump Boi
- Page 351 and 352:
7.46 CHAPTER SEVEN Sequence of Oper
- Page 353 and 354:
7.48 CHAPTER SEVEN FIGURE 7.20 (Con
- Page 355 and 356:
7.50 CHAPTER SEVEN Use of Balancing
- Page 357 and 358:
7.52 CHAPTER SEVEN 2. For Qcs/Qcs,d
- Page 359 and 360:
7.54 CHAPTER SEVEN The following ar
- Page 361 and 362:
7.56 CHAPTER SEVEN loops. However,
- Page 363 and 364:
7.58 CHAPTER SEVEN DDC system contr
- Page 365 and 366:
7.60 CHAPTER SEVEN REFERENCES Input
- Page 367 and 368:
CHAPTER 8 HEATING SYSTEMS, FURNACES
- Page 369 and 370:
8.2 WARM AIR FURNACES Types of Warm
- Page 371 and 372:
Heat exchanger Warm air supply plen
- Page 373 and 374:
Saving Energy ● Annual fuel utili
- Page 375 and 376:
Nighttime Setback. ASHRAE research
- Page 377 and 378:
HEATING SYSTEMS, FURNACES, AND BOIL
- Page 379 and 380:
Gas and Oil Burners When natural ga
- Page 381 and 382:
Modern packaged boilers often inclu
- Page 383 and 384:
Electric Hot Water Boilers elements
- Page 385 and 386:
where volume flow rate of supply ai
- Page 387 and 388:
Thermal Stratification divided into
- Page 389 and 390:
15°F (8.3°C) is usually used. The
- Page 391 and 392:
Design Considerations FIGURE 8.8 Ba
- Page 393 and 394:
finned tube is 1190 Btu/h (350 W).
- Page 395 and 396:
Heating flux q u, Btu/h•ft 2 Floo
- Page 397 and 398:
● Pulse-width-modulated zone cont
- Page 399 and 400:
Design and Layout HEATING SYSTEMS,
- Page 401 and 402:
REFERENCES HEATING SYSTEMS, FURNACE
- Page 403 and 404:
CHAPTER 9 REFRIGERANTS, REFRIGERATI
- Page 405 and 406:
9.2 REFRIGERANTS Refrigerants, Cool
- Page 407 and 408:
9.3 PROPERTIES AND CHARACTERISTICS
- Page 409 and 410:
● Halide torch. This method is si
- Page 411 and 412:
9.9 Specific volume of Power Critic
- Page 413 and 414:
Action and Measures REFRIGERANTS, R
- Page 415 and 416:
Because of the worldwide effort to
- Page 417 and 418:
Zeotropic HFC HFC-410A is a blend o
- Page 419 and 420:
Refrigeration Cycles Unit of Refrig
- Page 421 and 422:
the diagram and temperature T, °R,
- Page 423 and 424:
The heat extracted from the source
- Page 425 and 426:
REFRIGERANTS, REFRIGERATION CYCLES,
- Page 427 and 428:
REFRIGERANTS, REFRIGERATION CYCLES,
- Page 429 and 430:
REFRIGERANTS, REFRIGERATION CYCLES,
- Page 431 and 432:
With subcooling, Savings in electri
- Page 433 and 434:
calculated as where p con � conde
- Page 435 and 436:
Coefficient of Performance REFRIGER
- Page 437 and 438:
Then, from Eq. (9.33), the total wo
- Page 439 and 440:
x 1 at interstage pressure p i1 can
- Page 441 and 442:
REFRIGERANTS, REFRIGERATION CYCLES,
- Page 443 and 444:
REFRIGERANTS, REFRIGERATION CYCLES,
- Page 445 and 446:
REFRIGERANTS, REFRIGERATION CYCLES,
- Page 447 and 448:
From Eq. (9.22), the enthalpy diffe
- Page 449 and 450:
FIGURE 9.13 (Continued) where p 1,
- Page 451 and 452:
If �c, �t, TR1� , TR3, and pr
- Page 453 and 454:
Recent Developments ASHRAE Standard
- Page 455 and 456:
The only type of non-positive displ
- Page 457 and 458:
Energy Use Index In Eq. (9.71), m˙
- Page 459 and 460:
For institutional or health care oc
- Page 461 and 462:
Storage of Refrigerants REFERENCES
- Page 463 and 464:
CHAPTER 10 REFRIGERATION SYSTEMS: C
- Page 465 and 466:
● Shell-and-tube liquid cooler wi
- Page 467 and 468:
at an oil concentration of 3 percen
- Page 469 and 470:
or h al � h ae � �(h ae � h
- Page 471 and 472:
FIGURE 10.3 Control of DX coils at
- Page 473 and 474:
Example 10.1. A DX coil in a packag
- Page 475 and 476:
REFRIGERATION SYSTEMS: COMPONENTS 1
- Page 477 and 478:
where U dirty, U clean � overall
- Page 479 and 480:
Temperature difference T ee � T e
- Page 481 and 482:
FIGURE 10.7 (Continued) (b) Schemat
- Page 483 and 484:
Total Heat Rejection Compared with
- Page 485 and 486:
FIGURE 10.9 Double-tube condenser.
- Page 487 and 488:
It is important to recognize that t
- Page 489 and 490:
REFRIGERATION SYSTEMS: COMPONENTS 1
- Page 491 and 492:
A refrigeration system with a lower
- Page 493 and 494:
REFRIGERATION SYSTEMS: COMPONENTS 1
- Page 495 and 496:
Selection and Installation REFRIGER
- Page 497 and 498:
Counterflow Forced-Draft Cooling To
- Page 499 and 500:
air film that surrounds the condens
- Page 501 and 502:
By using the numerical integration
- Page 503 and 504:
Tower Coefficient and Water-Air Rat
- Page 505 and 506:
Construction Materials cellular fil
- Page 507 and 508:
(T w2 � T w1)/(h s � h a), or t
- Page 509 and 510:
Blowdown Legionnaires’ Disease va
- Page 511 and 512:
REFRIGERATION SYSTEMS: COMPONENTS 1
- Page 513 and 514:
The rated conditions of air-cooled
- Page 515 and 516:
The corresponding saturated tempera
- Page 517 and 518:
Electric Expansion Valves slugs may
- Page 519 and 520:
Capillary Tube FIGURE 10.21 Float v
- Page 521 and 522:
REFRIGERATION SYSTEMS: COMPONENTS 1
- Page 523 and 524:
11.2 CHAPTER ELEVEN 11.1 RECIPROCAT
- Page 525 and 526:
11.4 CHAPTER ELEVEN refrigerants. A
- Page 527 and 528:
11.6 FIGURE 11.5 Schematic reciproc
- Page 529 and 530:
11.8 CHAPTER ELEVEN Accessories sys
- Page 531 and 532:
11.10 CHAPTER ELEVEN into the inner
- Page 533 and 534:
11.12 CHAPTER ELEVEN FIGURE 11.8 Se
- Page 535 and 536:
11.14 CHAPTER ELEVEN Size of Copper
- Page 537 and 538:
11.16 CHAPTER ELEVEN TABLE 11.3 Fit
- Page 539 and 540:
11.18 CHAPTER ELEVEN FIGURE 11.10 S
- Page 541 and 542:
11.20 CHAPTER ELEVEN 5. The minimum
- Page 543 and 544:
11.22 CHAPTER ELEVEN If a receiver
- Page 545 and 546:
11.24 CHAPTER ELEVEN 11.5 CAPACITY
- Page 547 and 548:
11.26 CHAPTER ELEVEN Safety Control
- Page 549 and 550:
11.28 CHAPTER ELEVEN FIGURE 11.16 L
- Page 551 and 552:
11.30 CHAPTER ELEVEN Refrigeration
- Page 553 and 554:
11.32 CHAPTER ELEVEN Performance of
- Page 555 and 556:
11.34 CHAPTER ELEVEN 11.7 SYSTEM BA
- Page 557 and 558:
11.36 CHAPTER ELEVEN compression ra
- Page 559 and 560:
11.38 CHAPTER ELEVEN is superheated
- Page 561 and 562:
11.40 CHAPTER ELEVEN in Fig. 11.22,
- Page 563 and 564:
11.42 CHAPTER ELEVEN (2048 kPa abs.
- Page 565 and 566:
11.44 CHAPTER ELEVEN Scroll Compres
- Page 567 and 568:
11.46 CHAPTER ELEVEN Compressor Per
- Page 569 and 570:
11.48 CHAPTER ELEVEN System Charact
- Page 571 and 572:
11.50 CHAPTER ELEVEN are specified
- Page 573 and 574:
11.52 CHAPTER ELEVEN FIGURE 11.29 T
- Page 575 and 576:
11.54 CHAPTER ELEVEN Variable Volum
- Page 577 and 578:
11.56 CHAPTER ELEVEN REFERENCES ASH
- Page 579 and 580:
CHAPTER 12 HEAT PUMPS, HEAT RECOVER
- Page 581 and 582:
where h 2� � enthalpy of hot ga
- Page 583 and 584:
climates, cold supply air may be re
- Page 585 and 586:
FIGURE 12.3 (Continued) HEAT PUMPS,
- Page 587 and 588:
Operating Modes System Performance
- Page 589 and 590:
load. When the outdoor temperature
- Page 591 and 592:
Controls Capacity and Selection HEA
- Page 593 and 594:
FIGURE 12.5 A typical groundwater h
- Page 595 and 596:
HEAT PUMPS, HEAT RECOVERY, GAS COOL
- Page 597 and 598:
A vertical ground coil is buried fr
- Page 599 and 600:
Exhaust airstream Runaround Coil Lo
- Page 601 and 602:
HEAT PUMPS, HEAT RECOVERY, GAS COOL
- Page 603 and 604:
Comparison between Various Air-to-A
- Page 605 and 606:
Gas-Engine Chiller Gas Engines HEAT
- Page 607 and 608:
When the engine jacket water is rou
- Page 609 and 610:
CHAPTER 13 REFRIGERATION SYSTEMS: C
- Page 611 and 612:
Compressor REFRIGERATION SYSTEMS: C
- Page 613 and 614:
Purge Unit FIGURE 13.3 Orifice plat
- Page 615 and 616:
Types of Centrifugal Chiller match
- Page 617 and 618:
For water-cooled centrifugal chille
- Page 619 and 620:
FIGURE 13.5 (Continued ) REFRIGERAT
- Page 621 and 622:
(5.6 to 6.7°C) in temperature diff
- Page 623 and 624:
● The maintenance cost can be red
- Page 625 and 626:
FIGURE 13.10 (Continued ) where Q r
- Page 627 and 628:
13.6 CAPACITY CONTROL OF CENTRIFUGA
- Page 629 and 630:
Comparison between Inlet Vanes and
- Page 631 and 632:
Condenser Water Temperature Control
- Page 633 and 634:
7. After the oil pressure has been
- Page 635 and 636:
The log-mean temperature difference
- Page 637 and 638:
Therefore, from Eq. (13.12) the eva
- Page 639 and 640:
The actual percentage of design pow
- Page 641 and 642:
water enters the condenser T en, c
- Page 643 and 644:
Chiller Minimum Performance Design
- Page 645 and 646:
REFRIGERATION SYSTEMS: CENTRIFUGAL
- Page 647 and 648:
14.2 CHAPTER FOURTEEN Historical De
- Page 649 and 650:
14.4 CHAPTER FOURTEEN Equilibrium C
- Page 651 and 652:
14.6 CHAPTER FOURTEEN If an aqueous
- Page 653 and 654:
14.8 CHAPTER FOURTEEN Air Purge Uni
- Page 655 and 656:
14.10 CHAPTER FOURTEEN 10 5 20 40 1
- Page 657 and 658:
14.12 CHAPTER FOURTEEN Also, Therma
- Page 659 and 660:
14.14 CHAPTER FOURTEEN Coefficient
- Page 661 and 662:
14.16 CHAPTER FOURTEEN From the psy
- Page 663 and 664:
14.18 CHAPTER FOURTEEN bypass recir
- Page 665 and 666:
14.20 CHAPTER FOURTEEN Corrosion Co
- Page 667 and 668:
14.22 CHAPTER FOURTEEN Actual Perfo
- Page 669 and 670:
14.24 CHAPTER FOURTEEN absorber and
- Page 671 and 672:
14.26 CHAPTER FOURTEEN Coefficient
- Page 673 and 674:
CHAPTER 15 AIR SYSTEMS: COMPONENTS
- Page 675 and 676:
FIGURE 15.1 Types of fans: (a) cent
- Page 677 and 678:
The fan power input on the fan shaf
- Page 679 and 680:
where �p t,s � fan total pressu
- Page 681 and 682:
The total pressure developed is AIR
- Page 683 and 684:
Forward-Curved Fans AIR SYSTEMS: CO
- Page 685 and 686:
AIR SYSTEMS: COMPONENTS—FANS, COI
- Page 687 and 688:
AIR SYSTEMS: COMPONENTS—FANS, COI
- Page 689 and 690:
AIR SYSTEMS: COMPONENTS—FANS, COI
- Page 691 and 692:
AIR SYSTEMS: COMPONENTS—FANS, COI
- Page 693 and 694:
Inlet Vanes Modulation AIR SYSTEMS:
- Page 695 and 696:
Inlet Cone Modulation AIR SYSTEMS:
- Page 697 and 698:
the smooth airflow suddenly breaks
- Page 699 and 700:
High-Temperature Fans AIR SYSTEMS:
- Page 701 and 702:
FIGURE 15.24 Direction of rotation
- Page 703 and 704:
octave bands for axial fans are far
- Page 705 and 706:
Types of Coils Fins AIR SYSTEMS: CO
- Page 707 and 708:
AIR SYSTEMS: COMPONENTS—FANS, COI
- Page 709 and 710:
Contact Conductance AIR SYSTEMS: CO
- Page 711 and 712:
Water Circuits Contact conductance
- Page 713 and 714:
If the thermal resistance of copper
- Page 715 and 716:
AIR SYSTEMS: COMPONENTS—FANS, COI
- Page 717 and 718:
Coil Construction Parameters AIR SY
- Page 719 and 720:
And from Eq. (15.34), Assume � f
- Page 721 and 722:
Dry Part airstream and water stream
- Page 723 and 724:
FIGURE 15.32 Psychrometric analysis
- Page 725 and 726:
cooling and dehumidifying capacity
- Page 727 and 728:
From Eq. (15.27), Then the outer su
- Page 729 and 730:
Coil Cleanliness Drain and Isolatin
- Page 731 and 732:
AIR SYSTEMS: COMPONENTS—FANS, COI
- Page 733 and 734:
particles may range from � 1�m
- Page 735 and 736:
AIR SYSTEMS: COMPONENTS—FANS, COI
- Page 737 and 738:
15.14 AIR FILTERS Filtration Mechan
- Page 739 and 740:
● Most low-efficiency filters hav
- Page 741 and 742:
15.15 ELECTRONIC AIR CLEANERS AIR S
- Page 743 and 744:
usually decreases the adsorption ca
- Page 745 and 746:
FIGURE 15.41 Humidifying load for a
- Page 747 and 748:
Heating Element Humidifiers AIR SYS
- Page 749 and 750:
Ultrasonic Humidifiers An ultrasoni
- Page 751 and 752:
15.21 AIR WASHERS The air washer wa
- Page 753 and 754:
Bypass Control For a cooling and de
- Page 755 and 756:
industrial manufacturing processes
- Page 757 and 758:
REFERENCES AIR SYSTEMS: COMPONENTS
- Page 759 and 760:
CHAPTER 16 AIR SYSTEMS: EQUIPMENT
- Page 761 and 762:
FIGURE 16.1 Type of air-handling un
- Page 763 and 764:
Coils Filters Humidifiers AIR SYSTE
- Page 765 and 766:
AIR SYSTEMS: EQUIPMENT—AIR-HANDLI
- Page 767 and 768:
15.10, the cooling coil face veloci
- Page 769 and 770:
16.11 TABLE 16.2 Volume Flow and Fa
- Page 771 and 772:
AIR SYSTEMS: EQUIPMENT—AIR-HANDLI
- Page 773 and 774:
Indoor Packaged Units AIR SYSTEMS:
- Page 775 and 776:
Reciprocating and scroll compressor
- Page 777 and 778:
Minimum Performance 9. Compressor l
- Page 779 and 780:
16.21 TABLE 16.4 Supply Fan Perform
- Page 781 and 782:
There will be no carryover of conde
- Page 783 and 784:
AIR SYSTEMS: EQUIPMENT—AIR-HANDLI
- Page 785 and 786:
FIGURE 16.9 Interior core fan room:
- Page 787 and 788:
CHAPTER 17 AIR SYSTEMS: AIR DUCT DE
- Page 789 and 790:
p� 1 � � 1v 1 2 (17.4) If bot
- Page 791 and 792:
Stack Effect where � � air dens
- Page 793 and 794:
Velocity Distribution Equation of C
- Page 795 and 796:
FIGURE 17.3 Pressure characteristic
- Page 797 and 798:
where Psy � each air system total
- Page 799 and 800:
Rectangular Ducts AIR SYSTEMS: AIR
- Page 801 and 802:
17.15 TABLE 17.2 Rectangular Ferrou
- Page 803 and 804:
TABLE 17.4 Round Ferrous Metal Duct
- Page 805 and 806:
17.4 DUCT HEAT GAIN, HEAT LOSS, AND
- Page 807 and 808:
Temperature Rise Curves If the temp
- Page 809 and 810:
In an ideal smooth tube or duct, th
- Page 811 and 812:
loss per unit length �p f, in in.
- Page 813 and 814:
Circular Equivalents Example 17.1.
- Page 815 and 816:
17.29 42 15.6 17.1 18.5 19.9 21.1 2
- Page 817 and 818:
For galvanized steel flat oval duct
- Page 819 and 820:
AIR SYSTEMS: AIR DUCT DESIGN 17.33
- Page 821 and 822:
FIGURE 17.12 Round and flat oval te
- Page 823 and 824:
FIGURE 17.14 Openings mounted on a
- Page 825 and 826:
FIGURE 17.16 Total pressure loss
- Page 827 and 828:
FIGURE 17.17 Combination of flow re
- Page 829 and 830:
Fig. 17.19a, are given as and (17.6
- Page 831 and 832:
● An optimal duct system layout w
- Page 833 and 834:
● From node 1, the total pressure
- Page 835 and 836:
TABLE 17.10 Duct Leakage Classifica
- Page 837 and 838:
each fire damper. Many regulatory a
- Page 839 and 840:
The designer then compares various
- Page 841 and 842:
T Method planes 1 and 2, and the vo
- Page 843 and 844:
h, or in I-P units For SI units, FI
- Page 845 and 846:
When the total pressure loss of the
- Page 847 and 848:
TABLE 17.11 Local Loss Coefficients
- Page 849 and 850:
Return or Exhaust Duct Systems AIR
- Page 851 and 852:
and the sized diameter 0.0147 � 2
- Page 853 and 854:
FIGURE 17.25 Rectangular supply duc
- Page 855 and 856:
If the height of the rectangular du
- Page 857 and 858:
FIGURE 17.28 A return duct system w
- Page 859 and 860:
Design Interface AIR SYSTEMS: AIR D
- Page 861 and 862:
vacuum used in duct cleaning is oft
- Page 863 and 864:
accurate measurement, an inclined m
- Page 865 and 866:
AIR SYSTEMS: AIR DUCT DESIGN 17.79
- Page 867 and 868:
18.2 CHAPTER EIGHTEEN Design Consid
- Page 869 and 870:
18.4 CHAPTER EIGHTEEN cooling load
- Page 871 and 872:
18.6 CHAPTER EIGHTEEN FIGURE 18.2 F
- Page 873 and 874:
18.8 CHAPTER EIGHTEEN Confined Air
- Page 875 and 876:
18.10 CHAPTER EIGHTEEN Free Nonisot
- Page 877 and 878:
18.12 CHAPTER EIGHTEEN Ceiling Diff
- Page 879 and 880:
18.14 CHAPTER EIGHTEEN Slot Diffuse
- Page 881 and 882:
18.16 CHAPTER EIGHTEEN TABLE 18.1 P
- Page 883 and 884:
18.18 CHAPTER EIGHTEEN FIGURE 18.12
- Page 885 and 886:
18.20 CHAPTER EIGHTEEN 18.4 MIXING
- Page 887 and 888:
18.22 CHAPTER EIGHTEEN FIGURE 18.15
- Page 889 and 890:
18.24 CHAPTER EIGHTEEN FIGURE 18.17
- Page 891 and 892:
18.26 CHAPTER EIGHTEEN FIGURE 18.19
- Page 893 and 894:
18.28 CHAPTER EIGHTEEN ● The loca
- Page 895 and 896:
18.30 CHAPTER EIGHTEEN ● The aver
- Page 897 and 898:
18.32 CHAPTER EIGHTEEN ● Cost. In
- Page 899 and 900:
18.34 CHAPTER EIGHTEEN ● A termin
- Page 901 and 902:
18.36 CHAPTER EIGHTEEN FIGURE 18.22
- Page 903 and 904:
18.38 CHAPTER EIGHTEEN The return s
- Page 905 and 906:
18.40 CHAPTER EIGHTEEN Ventilating
- Page 907 and 908:
18.42 CHAPTER EIGHTEEN 18.8 STRATIF
- Page 909 and 910:
18.44 CHAPTER EIGHTEEN 18.9 PROJECT
- Page 911 and 912:
18.46 CHAPTER EIGHTEEN Target Veloc
- Page 913 and 914:
18.48 CHAPTER EIGHTEEN Application
- Page 915 and 916:
18.50 CHAPTER EIGHTEEN Heat Unneutr
- Page 917 and 918:
18.52 CHAPTER EIGHTEEN CFD Becomes
- Page 919 and 920:
18.54 CHAPTER EIGHTEEN Conducting C
- Page 921 and 922:
18.56 CHAPTER EIGHTEEN Wendes, H.,
- Page 923 and 924:
19.2 CHAPTER NINETEEN Sound Paths T
- Page 925 and 926:
19.4 CHAPTER NINETEEN 9. Check this
- Page 927 and 928:
19.6 CHAPTER NINETEEN Branch ducts
- Page 929 and 930:
19.8 CHAPTER NINETEEN TABLE 19.3 So
- Page 931 and 932:
19.10 CHAPTER NINETEEN End Reflecti
- Page 933 and 934:
19.12 CHAPTER NINETEEN 19.4 SILENCE
- Page 935 and 936:
19.14 CHAPTER NINETEEN facing. A so
- Page 937 and 938:
19.16 CHAPTER NINETEEN Active Silen
- Page 939 and 940:
19.18 CHAPTER NINETEEN Recommendati
- Page 941 and 942:
19.20 CHAPTER NINETEEN FIGURE 19.6
- Page 943 and 944:
19.22 CHAPTER NINETEEN TABLE 19.11
- Page 945 and 946:
19.24 CHAPTER NINETEEN Array of Cei
- Page 947 and 948:
19.26 CHAPTER NINETEEN Environmenta
- Page 949 and 950:
19.28 CHAPTER NINETEEN Octave band
- Page 951 and 952:
19.30 CHAPTER NINETEEN Sound Source
- Page 953 and 954:
19.32 CHAPTER NINETEEN Structure-Bo
- Page 955 and 956:
CHAPTER 20 AIR SYSTEMS: BASICS AND
- Page 957 and 958:
Air Distribution Systems Ventilatio
- Page 959 and 960:
20.2 BUILDING LEAKAGE AREA AND BUIL
- Page 961 and 962:
20.3 SPACE PRESSURIZATION Space Pre
- Page 963 and 964:
doors and windows are closed. When
- Page 965 and 966:
Wind speed from a meteorological st
- Page 967 and 968:
In Eq. (20.8), m˙ inf indicates th
- Page 969 and 970:
System Operating Point FIGURE 20.4
- Page 971 and 972:
20.6 SYSTEM EFFECT ● Condition 1.
- Page 973 and 974:
Inlet System Effect Loss fan inlet
- Page 975 and 976:
FIGURE 20.7 Outlet system effect: (
- Page 977 and 978:
For a SWSI centrifugal fan with A b
- Page 979 and 980:
Two Fan-Duct Systems Connected in S
- Page 981 and 982:
volume flow and fan total pressure.
- Page 983 and 984:
FIGURE 20.12 Two parallel fan-duct
- Page 985 and 986:
Similarly, the residual pressure of
- Page 987 and 988:
Modulation of Fan-Duct Systems AIR
- Page 989 and 990:
FIGURE 20.14 (Continued) AIR SYSTEM
- Page 991 and 992:
Plot the fan performance curve Ft a
- Page 993 and 994:
20.9 CLASSIFICATION OF AIR SYSTEMS
- Page 995 and 996:
To save energy, most AHU and PU man
- Page 997 and 998:
where ws,wr � humidity ratio at t
- Page 999 and 1000:
exchanger is called the sensible co
- Page 1001 and 1002:
compressed air, or ultrasonic force
- Page 1003 and 1004:
AIR SYSTEMS: BASICS AND CONSTANT-VO
- Page 1005 and 1006:
FIGURE 20.21 Adiabatic mixing and b
- Page 1007 and 1008:
and the heating coil load is 20.16
- Page 1009 and 1010:
Cooling mode operation in summer co
- Page 1011 and 1012:
ecirculating air m is usually lower
- Page 1013 and 1014:
● Outdoor damper activates with s
- Page 1015 and 1016:
3. To provide a desirable air veloc
- Page 1017 and 1018:
Air Conditioning Rules Graphical Me
- Page 1019 and 1020:
FIGURE 20.25 Effect of sensible hea
- Page 1021 and 1022:
2. Because the air temperature at t
- Page 1023 and 1024:
At a temperature of 72°F (22.2°C)
- Page 1025 and 1026:
Because w m � w s, Therefore, Fro
- Page 1027 and 1028:
Part-Load Operation 7. Draw a verti
- Page 1029 and 1030:
Reheating is a simple and effective
- Page 1031 and 1032:
Operating Parameters and Calculatio
- Page 1033 and 1034:
REFERENCES AIR SYSTEMS: BASICS AND
- Page 1035 and 1036:
21.2 CHAPTER TWENTY-ONE 21.1 SYSTEM
- Page 1037 and 1038:
FIGURE 21.1 A single-zone VAV syste
- Page 1039 and 1040:
21.6 CHAPTER TWENTY-ONE FIGURE 21.2
- Page 1041 and 1042:
21.8 CHAPTER TWENTY-ONE Region IV:
- Page 1043 and 1044:
21.10 CHAPTER TWENTY-ONE dry-bulb e
- Page 1045 and 1046:
21.12 CHAPTER TWENTY-ONE Consider a
- Page 1047 and 1048:
21.14 CHAPTER TWENTY-ONE ● The ou
- Page 1049 and 1050:
21.16 CHAPTER TWENTY-ONE outdoor ve
- Page 1051 and 1052:
21.18 CHAPTER TWENTY-ONE 7. When T
- Page 1053 and 1054:
21.20 CHAPTER TWENTY-ONE VAV Reheat
- Page 1055 and 1056:
21.22 CHAPTER TWENTY-ONE FIGURE 21.
- Page 1057 and 1058:
21.24 CHAPTER TWENTY-ONE FIGURE 21.
- Page 1059 and 1060:
21.26 CHAPTER TWENTY-ONE In dead-ba
- Page 1061 and 1062:
21.28 CHAPTER TWENTY-ONE For the pe
- Page 1063 and 1064:
21.30 CHAPTER TWENTY-ONE calculated
- Page 1065 and 1066:
21.32 CHAPTER TWENTY-ONE For the wi
- Page 1067 and 1068:
21.34
- Page 1069 and 1070:
21.36 CHAPTER TWENTY-ONE Number of
- Page 1071 and 1072:
21.38 CHAPTER TWENTY-ONE Mixing Mod
- Page 1073 and 1074:
21.40 CHAPTER TWENTY-ONE ● Modula
- Page 1075 and 1076:
21.42 CHAPTER TWENTY-ONE where Q rs
- Page 1077 and 1078:
21.44 CHAPTER TWENTY-ONE From Eq. (
- Page 1079 and 1080:
FIGURE 21.13 (Continued) 21.46
- Page 1081 and 1082:
21.48 CHAPTER TWENTY-ONE Fan-Powere
- Page 1083 and 1084:
21.50 CHAPTER TWENTY-ONE The drawba
- Page 1085 and 1086:
21.52 CHAPTER TWENTY-ONE Zone Contr
- Page 1087 and 1088:
21.54 CHAPTER TWENTY-ONE Percentage
- Page 1089 and 1090:
21.56 CHAPTER TWENTY-ONE ● During
- Page 1091 and 1092:
21.58 CHAPTER TWENTY-ONE Wendes, H.
- Page 1093 and 1094:
22.2 CHAPTER TWENTY-TWO 22.1 RETURN
- Page 1095 and 1096:
22.4 CHAPTER TWENTY-TWO 22.2 FAN CO
- Page 1097 and 1098:
22.6 CHAPTER TWENTY-TWO Recirculati
- Page 1099 and 1100:
22.8 CHAPTER TWENTY-TWO flow rate o
- Page 1101 and 1102:
22.10 CHAPTER TWENTY-TWO FIGURE 22.
- Page 1103 and 1104:
22.12 CHAPTER TWENTY-TWO The system
- Page 1105 and 1106:
22.14 CHAPTER TWENTY-TWO to balance
- Page 1107 and 1108:
22.16 CHAPTER TWENTY-TWO The fixed
- Page 1109 and 1110:
22.18 CHAPTER TWENTY-TWO air is ext
- Page 1111 and 1112:
22.20 CHAPTER TWENTY-TWO Air Econom
- Page 1113 and 1114:
22.22 CHAPTER TWENTY-TWO (2) The re
- Page 1115 and 1116:
22.24 CHAPTER TWENTY-TWO FIGURE 22.
- Page 1117 and 1118:
22.26 CHAPTER TWENTY-TWO FIGURE 22.
- Page 1119 and 1120:
22.28 CHAPTER TWENTY-TWO ● The as
- Page 1121 and 1122:
22.30 CHAPTER TWENTY-TWO FIGURE 22.
- Page 1123 and 1124:
22.32 CHAPTER TWENTY-TWO Design Con
- Page 1125 and 1126:
22.34 CHAPTER TWENTY-TWO �a � a
- Page 1127 and 1128:
22.36 CHAPTER TWENTY-TWO The pressu
- Page 1129 and 1130:
22.38 CHAPTER TWENTY-TWO REFERENCES
- Page 1131 and 1132:
CHAPTER 23 AIR SYSTEMS: MINIMUM VEN
- Page 1133 and 1134:
ASHRAE Standard 62-1999 control, a
- Page 1135 and 1136:
The system outdoor air volume flow
- Page 1137 and 1138:
CO 2 Sensor or Mixed-Gases Sensor L
- Page 1139 and 1140:
supplied to a control zone in a VAV
- Page 1141 and 1142:
Economizer damper Exhaust damper Mi
- Page 1143 and 1144:
AIR SYSTEMS: MINIMUM VENTILATION AN
- Page 1145 and 1146:
● The maximum supply volume flow
- Page 1147 and 1148:
where m˙ ex,r, m˙ eu � mass flo
- Page 1149 and 1150:
System Description AIR SYSTEMS: MIN
- Page 1151 and 1152:
AIR SYSTEMS: MINIMUM VENTILATION AN
- Page 1153 and 1154:
● It lowers the duct heat gain or
- Page 1155 and 1156:
AIR SYSTEMS: MINIMUM VENTILATION AN
- Page 1157 and 1158:
Steam Humidifier Control Dew Point
- Page 1159 and 1160:
consumption than proportional contr
- Page 1161 and 1162:
AIR SYSTEMS: MINIMUM VENTILATION AN
- Page 1163 and 1164:
AIR SYSTEMS: MINIMUM VENTILATION AN
- Page 1165 and 1166:
REFERENCES AIR SYSTEMS: MINIMUM VEN
- Page 1167 and 1168:
24.1 IAQ PROBLEMS CHAPTER 24 IMPROV
- Page 1169 and 1170:
air economizer cycle and mixed air
- Page 1171 and 1172:
Sundell (1996) noted that many stud
- Page 1173 and 1174:
Service Life of Air Filters Filter
- Page 1175 and 1176:
● To eliminate or to reduce indoo
- Page 1177 and 1178:
Chemisorption Fig. 24.1, the sharp
- Page 1179 and 1180:
and final filter in air systems wit
- Page 1181 and 1182:
REFERENCES IMPROVING INDOOR AIR QUA
- Page 1183 and 1184:
25.2 CHAPTER TWENTY-FIVE energy res
- Page 1185 and 1186:
25.4 CHAPTER TWENTY-FIVE Mitigating
- Page 1187 and 1188:
25.6 CHAPTER TWENTY-FIVE Energy Aud
- Page 1189 and 1190:
25.8 CHAPTER TWENTY-FIVE Green Buil
- Page 1191 and 1192:
25.10 CHAPTER TWENTY-FIVE Energy St
- Page 1193 and 1194:
25.12 CHAPTER TWENTY-FIVE 25.5 CASE
- Page 1195 and 1196:
25.14 CHAPTER TWENTY-FIVE For both
- Page 1197 and 1198:
25.16 CHAPTER TWENTY-FIVE Unit elec
- Page 1199 and 1200:
25.18 CHAPTER TWENTY-FIVE Physical
- Page 1201 and 1202:
25.20 CHAPTER TWENTY-FIVE condensin
- Page 1203 and 1204:
25.22 CHAPTER TWENTY-FIVE Condenser
- Page 1205 and 1206:
25.24 CHAPTER TWENTY-FIVE The polyn
- Page 1207 and 1208:
25.26 CHAPTER TWENTY-FIVE Loads Sys
- Page 1209 and 1210:
25.28 CHAPTER TWENTY-FIVE ● Recip
- Page 1211 and 1212:
25.30 CHAPTER TWENTY-FIVE Scientifi
- Page 1213 and 1214:
26.2 CHAPTER TWENTY-SIX The purpose
- Page 1215 and 1216:
26.4 CHAPTER TWENTY-SIX requiring l
- Page 1217 and 1218:
26.6 CHAPTER TWENTY-SIX the nutriti
- Page 1219 and 1220:
26.8 CHAPTER TWENTY-SIX Space Limit
- Page 1221 and 1222:
26.10 CHAPTER TWENTY-SIX and throug
- Page 1223 and 1224:
26.12 CHAPTER TWENTY-SIX Controls F
- Page 1225 and 1226:
26.14 CHAPTER TWENTY-SIX Exterior l
- Page 1227 and 1228:
26.16 CHAPTER TWENTY-SIX Harold, R.
- Page 1229 and 1230:
27.2 CHAPTER TWENTY-SEVEN condition
- Page 1231 and 1232:
27.4 CHAPTER TWENTY-SEVEN 2. Water-
- Page 1233 and 1234:
27.6 CHAPTER TWENTY-SEVEN TABLE 27.
- Page 1235 and 1236:
27.8 CHAPTER TWENTY-SEVEN FIGURE 27
- Page 1237 and 1238:
27.10 CHAPTER TWENTY-SEVEN Effectiv
- Page 1239 and 1240:
27.12 CHAPTER TWENTY-SEVEN consumpt
- Page 1241 and 1242:
50 50 13.0 27.14 40 40 60 60 50 50
- Page 1243 and 1244:
27.16 CHAPTER TWENTY-SEVEN Assume t
- Page 1245 and 1246:
27.18 CHAPTER TWENTY-SEVEN System C
- Page 1247 and 1248:
27.20 CHAPTER TWENTY-SEVEN If the e
- Page 1249 and 1250:
27.22 CHAPTER TWENTY-SEVEN coil and
- Page 1251 and 1252:
27.24 CHAPTER TWENTY-SEVEN warm and
- Page 1253 and 1254:
27.26 CHAPTER TWENTY-SEVEN REFERENC
- Page 1255 and 1256:
CHAPTER 28 AIR CONDITIONING SYSTEMS
- Page 1257 and 1258:
Induction Systems annoying. A recei
- Page 1259 and 1260:
Fan-Coil Units AIR CONDITIONING SYS
- Page 1261 and 1262:
Volume Flow Rate Fan Motor. Permane
- Page 1263 and 1264:
Heating Capacity If the sensible he
- Page 1265 and 1266:
where � ps � air density of out
- Page 1267 and 1268:
Part-Load Operation At cooling mode
- Page 1269 and 1270:
TABLE 28.1 System Characteristics o
- Page 1271 and 1272:
AIR CONDITIONING SYSTEMS: SPACE CON
- Page 1273 and 1274:
where w s � humidity ratio of fan
- Page 1275 and 1276:
In a typical nonchangeover two-pipe
- Page 1277 and 1278:
For all the rooms in the perimeter
- Page 1279 and 1280:
Loop Temperatures AIR CONDITIONING
- Page 1281 and 1282:
leaving condition of 60°F (15.6°C
- Page 1283 and 1284:
Water Heater Storage Tanks heat pum
- Page 1285 and 1286:
System Characteristics starts the f
- Page 1287 and 1288:
● If ceiling units are used, good
- Page 1289 and 1290:
CHAPTER 29 AIR CONDITIONING SYSTEMS
- Page 1291 and 1292:
Applications AC SYSTEMS: PACKAGED A
- Page 1293 and 1294:
Controls Energy Use Intensities Sys
- Page 1295 and 1296: 29.3 SINGLE-ZONE VAV PACKAGED SYSTE
- Page 1297 and 1298: d. That is capable of being set bac
- Page 1299 and 1300: volume flow rate when the total pre
- Page 1301 and 1302: FIGURE 29.2 A VAV reheat packaged s
- Page 1303 and 1304: liquid slugging. Liquid slugging ma
- Page 1305 and 1306: A VAV packaged system is shut off d
- Page 1307 and 1308: more widely used. Fan-powered VAV p
- Page 1309 and 1310: AC SYSTEMS: PACKAGED AND DESICCANT-
- Page 1311 and 1312: AC SYSTEMS: PACKAGED AND DESICCANT-
- Page 1313 and 1314: FIGURE 29.4 A desiccant-based air c
- Page 1315 and 1316: As defined in Sec. 3.4, a sorption
- Page 1317 and 1318: flow rate of the mixture of the pro
- Page 1319 and 1320: Part-Load Operation and Controls Wh
- Page 1321 and 1322: System Description AC SYSTEMS: PACK
- Page 1323 and 1324: System Characteristics REFERENCES A
- Page 1325 and 1326: CHAPTER 30 AIR CONDITIONING SYSTEMS
- Page 1327 and 1328: ● Special process temperature and
- Page 1329 and 1330: Air and Water Temperature Different
- Page 1331 and 1332: of a VAV system using inlet vane mo
- Page 1333 and 1334: System Characterisics System charac
- Page 1335 and 1336: System Characteristics the supply a
- Page 1337 and 1338: System Characteristics AC SYSTEMS:
- Page 1339 and 1340: FIGURE 30.1 A clean-room system for
- Page 1341 and 1342: Manufacturing an integrated circuit
- Page 1343 and 1344: Summer Mode Operation Room temperat
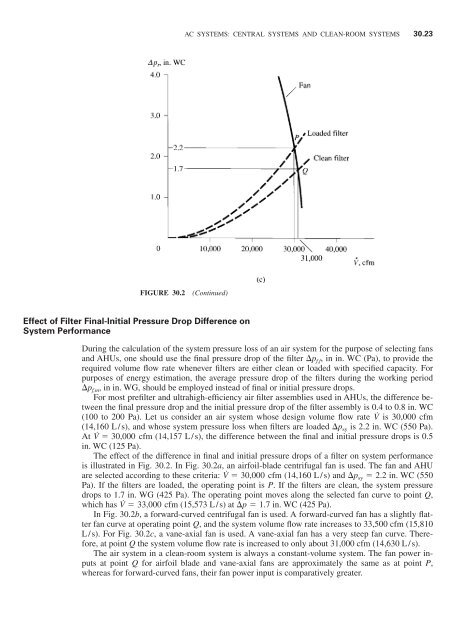
- Page 1345: System Pressure AC SYSTEMS: CENTRAL
- Page 1349 and 1350: AC SYSTEMS: CENTRAL SYSTEMS AND CLE
- Page 1351 and 1352: 31.2 CHAPTER THIRTY-ONE mechanical
- Page 1353 and 1354: 31.4 CHAPTER THIRTY-ONE Refrigerati
- Page 1355 and 1356: 31.6 CHAPTER THIRTY-ONE 31.2 ICE-ON
- Page 1357 and 1358: 31.8 CHAPTER THIRTY-ONE FIGURE 31.3
- Page 1359 and 1360: 31.10 CHAPTER THIRTY-ONE TABLE 31.1
- Page 1361 and 1362: 31.12 CHAPTER THIRTY-ONE Water leve
- Page 1363 and 1364: 31.14 CHAPTER THIRTY-ONE Location o
- Page 1365 and 1366: 31.16 CHAPTER THIRTY-ONE FIGURE 31.
- Page 1367 and 1368: 31.18 CHAPTER THIRTY-ONE In additio
- Page 1369 and 1370: 31.20 CHAPTER THIRTY-ONE Temperatur
- Page 1371 and 1372: 31.22 CHAPTER THIRTY-ONE volume flo
- Page 1373 and 1374: 31.24 CHAPTER THIRTY-ONE Storage co
- Page 1375 and 1376: 31.26 CHAPTER THIRTY-ONE Charging P
- Page 1377 and 1378: 31.28 CHAPTER THIRTY-ONE System Per
- Page 1379 and 1380: CHAPTER 32 COMMISSIONING AND MAINTE
- Page 1381 and 1382: ● Clarifly owner priorities and d
- Page 1383 and 1384: intent. The CC also makes sure that
- Page 1385 and 1386: APPENDIX A NOMENCLATURE AND ABBREVI
- Page 1387 and 1388: I DN i m I a I rad I ref I t solar
- Page 1389 and 1390: SC shadding coefficient Sc Schmidt
- Page 1391 and 1392: 2g second-stage generator go satura
- Page 1393 and 1394: � relative humidity, percent; sol
- Page 1395 and 1396: APPENDIX B PSYCHROMETRIC CHART, TAB
- Page 1397 and 1398:
B.3 TABLE B.1 Thermodynamic Propert
- Page 1399 and 1400:
TABLE B.2 Physical Properties of Ai
- Page 1401:
PSYCHROMETRIC CHART, TABLES OF PROP