Il fiume Fortore - Studi preliminari al piano di gestione dei SIC
Il fiume Fortore - Studi preliminari al piano di gestione dei SIC
Il fiume Fortore - Studi preliminari al piano di gestione dei SIC

You also want an ePaper? Increase the reach of your titles
YUMPU automatically turns print PDFs into web optimized ePapers that Google loves.
An t o n e l l a De Iuliiis<br />
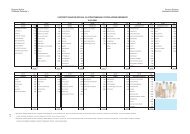
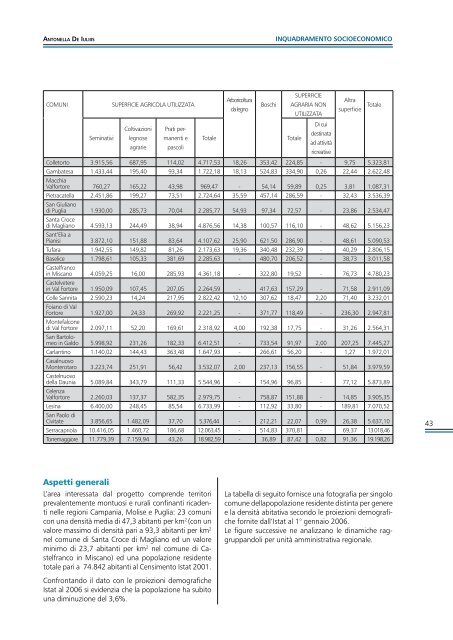
INQUADRAMENTO SOCIOECONOMICO<br />
COMUNI<br />
Seminativi<br />
SUPERFICIE AGRICOLA UTILIZZATA<br />
Coltivazioni<br />
legnose<br />
agrarie<br />
Prati permanenti<br />
e<br />
pascoli<br />
Tot<strong>al</strong>e<br />
Arboricoltura<br />
da legno<br />
Boschi<br />
SUPERFICIE<br />
AGRARIA NON<br />
Tot<strong>al</strong>e<br />
UTILIZZATA<br />
Di cui<br />
destinata<br />
ad attività<br />
ricreative<br />
Altra<br />
superficie<br />
Colletorto 3.915,56 687,95 114,02 4.717,53 18,26 353,42 224,85 - 9,75 5.323,81<br />
Gambatesa 1.433,44 195,40 93,34 1.722,18 18,13 524,83 334,90 0,26 22,44 2.622,48<br />
Macchia<br />
V<strong>al</strong>fortore 760,27 165,22 43,98 969,47 - 54,14 59,89 0,25 3,81 1.087,31<br />
Pietracatella 2.451,86 199,27 73,51 2.724,64 35,59 457,14 286,59 - 32,43 3.536,39<br />
San Giuliano<br />
<strong>di</strong> Puglia 1.930,00 285,73 70,04 2.285,77 54,93 97,34 72,57 - 23,86 2.534,47<br />
Santa Croce<br />
<strong>di</strong> Magliano 4.593,13 244,49 38,94 4.876,56 14,38 100,57 116,10 - 48,62 5.156,23<br />
Sant’Elia a<br />
Pianisi 3.872,10 151,88 83,64 4.107,62 25,90 621,50 286,90 - 48,61 5.090,53<br />
Tufara 1.942,55 149,82 81,26 2.173,63 19,36 340,48 232,39 - 40,29 2.806,15<br />
Baselice 1.798,61 105,33 381,69 2.285,63 - 480,70 206,52 - 38,73 3.011,58<br />
Castelfranco<br />
in Miscano 4.059,25 16,00 285,93 4.361,18 - 322,80 19,52 - 76,73 4.780,23<br />
Castelvetere<br />
in V<strong>al</strong> <strong>Fortore</strong> 1.950,09 107,45 207,05 2.264,59 - 417,63 157,29 - 71,58 2.911,09<br />
Colle Sannita 2.590,23 14,24 217,95 2.822,42 12,10 307,62 18,47 2,20 71,40 3.232,01<br />
Foiano <strong>di</strong> V<strong>al</strong><br />
<strong>Fortore</strong> 1.927,00 24,33 269,92 2.221,25 - 371,77 118,49 - 236,30 2.947,81<br />
Montef<strong>al</strong>cone<br />
<strong>di</strong> V<strong>al</strong> <strong>Fortore</strong> 2.097,11 52,20 169,61 2.318,92 4,00 192,38 17,75 - 31,26 2.564,31<br />
San Bartolomeo<br />
in G<strong>al</strong>do 5.998,92 231,26 182,33 6.412,51 - 733,54 91,97 2,00 207,25 7.445,27<br />
Carlantino 1.140,02 144,43 363,48 1.647,93 - 266,61 56,20 - 1,27 1.972,01<br />
Cas<strong>al</strong>nuovo<br />
Monterotaro 3.223,74 251,91 56,42 3.532,07 2,00 237,13 156,55 - 51,84 3.979,59<br />
Castelnuovo<br />
della Daunia 5.089,84 343,79 111,33 5.544,96 - 154,96 96,85 - 77,12 5.873,89<br />
Celenza<br />
V<strong>al</strong>fortore 2.260,03 137,37 582,35 2.979,75 - 758,87 151,88 - 14,85 3.905,35<br />
Lesina 6.400,00 248,45 85,54 6.733,99 - 112,92 33,80 - 189,81 7.070,52<br />
San Paolo <strong>di</strong><br />
Civitate 3.856,65 1.482,09 37,70 5.376,44 - 212,21 22,07 0,99 26,38 5.637,10<br />
Serracapriola 10.416,05 1.460,72 186,68 12.063,45 - 514,83 370,81 - 69,37 13.018,46<br />
Torremaggiore 11.779,39 7.159,94 43,26 18.982,59 - 36,89 87,42 0,82 91,36 19.198,26<br />
Tot<strong>al</strong>e<br />
43<br />
Aspetti gener<strong>al</strong>i<br />
L’area interessata d<strong>al</strong> progetto comprende territori<br />
prev<strong>al</strong>entemente montuosi e rur<strong>al</strong>i confinanti ricadenti<br />
nelle regioni Campania, Molise e Puglia: 23 comuni<br />
con una densità me<strong>di</strong>a <strong>di</strong> 47,3 abitanti per km 2 (con un<br />
v<strong>al</strong>ore massimo <strong>di</strong> densità pari a 93,3 abitanti per km 2<br />
nel comune <strong>di</strong> Santa Croce <strong>di</strong> Magliano ed un v<strong>al</strong>ore<br />
minimo <strong>di</strong> 23,7 abitanti per km 2 nel comune <strong>di</strong> Castelfranco<br />
in Miscano) ed una popolazione residente<br />
tot<strong>al</strong>e pari a 74.842 abitanti <strong>al</strong> Censimento Istat 2001.<br />
La tabella <strong>di</strong> seguito fornisce una fotografia per singolo<br />
comune dellapopolazione residente <strong>di</strong>stinta per genere<br />
e la densità abitativa secondo le proiezioni demografiche<br />
fornite d<strong>al</strong>l’Istat <strong>al</strong> 1° gennaio 2006.<br />
Le figure successive ne an<strong>al</strong>izzano le <strong>di</strong>namiche raggruppandoli<br />
per unità amministrativa region<strong>al</strong>e.<br />
Confrontando il dato con le proiezioni demografiche<br />
Istat <strong>al</strong> 2006 si evidenzia che la popolazione ha subito<br />
una <strong>di</strong>minuzione del 3,6%.