

Modelagem da dinâmica espacial como uma ... - mtc-m12:80 - Inpe
Modelagem da dinâmica espacial como uma ... - mtc-m12:80 - Inpe
Modelagem da dinâmica espacial como uma ... - mtc-m12:80 - Inpe

Create successful ePaper yourself
Turn your PDF publications into a flip-book with our unique Google optimized e-Paper software.
Taxa Proporcional k<br />
1989<br />
Taxa Proporcional k<br />
Taxa Proporcional k<br />
= Taxa Proporcionalk 2<br />
1985<br />
1993<br />
= PIB Setorialk PIB Total 1985<br />
= VA Setorialk VA Total 1993<br />
121<br />
(1985 + 1993)<br />
, (4.8)<br />
, (4.9)<br />
. (4.10)<br />
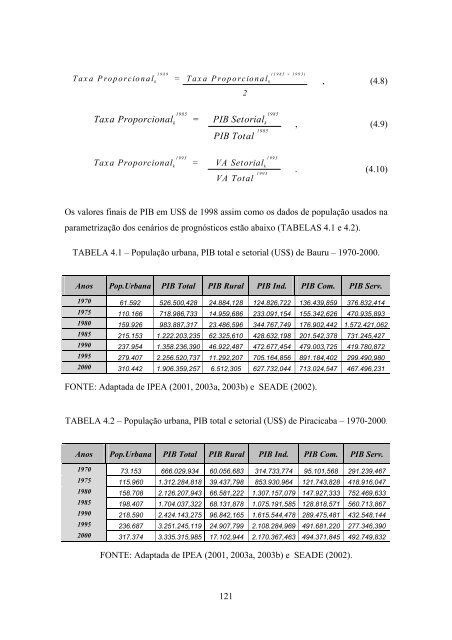
Os valores finais de PIB em US$ de 1998 assim <strong>como</strong> os <strong>da</strong>dos de população usados na<br />
parametrização dos cenários de prognósticos estão abaixo (TABELAS 4.1 e 4.2).<br />
TABELA 4.1 – População urbana, PIB total e setorial (US$) de Bauru – 1970-2000.<br />
Anos Pop.Urbana PIB Total PIB Rural PIB Ind. PIB Com. PIB Serv.<br />
1970 61.592 526.500,428 24.884,128 124.826,722 136.439,859 376.832,414<br />
1975 110.166 718.986,733 14.959,686 233.091,154 155.342,626 470.935,893<br />
19<strong>80</strong> 159.926 983.887,317 23.486,596 344.767,749 176.902,442 1.572.421,062<br />
1985 215.153 1.222.203,235 62.325,610 428.632,198 201.542,378 731.245,427<br />
1990 237.954 1.358.236,390 46.922,487 472.677,454 479.003,725 419.7<strong>80</strong>,872<br />
1995 279.407 2.256.520,737 11.292,207 705.164,856 891.184,402 299.490,9<strong>80</strong><br />
2000 310.442 1.906.359,257 6.512,305 627.732,044 713.024,547 467.496,231<br />
FONTE: A<strong>da</strong>pta<strong>da</strong> de IPEA (2001, 2003a, 2003b) e SEADE (2002).<br />
TABELA 4.2 – População urbana, PIB total e setorial (US$) de Piracicaba – 1970-2000.<br />
Anos Pop.Urbana PIB Total PIB Rural PIB Ind. PIB Com. PIB Serv.<br />
1970 73.153 666.029,934 60.056,683 314.733,774 95.101,568 291.239,467<br />
1975 115.960 1.312.284,818 39.437,798 853.930,964 121.743,828 418.916,047<br />
19<strong>80</strong> 158.708 2.126.207,943 66.581,222 1.307.157,079 147.927,333 752.469,633<br />
1985 198.407 1.704.037,322 68.131,878 1.075.191,585 128.818,571 560.713,867<br />
1990 218.590 2.424.143,275 96.842,165 1.615.544,478 289.475,481 432.548,144<br />
1995 236.687 3.251.245,119 24.907,799 2.108.284,969 491.681,220 277.346,390<br />
2000 317.374 3.335.315,985 17.102,944 2.170.367,463 494.371,845 492.749,832<br />
FONTE: A<strong>da</strong>pta<strong>da</strong> de IPEA (2001, 2003a, 2003b) e SEADE (2002).<br />
1985<br />
1993