- Page 2:
.. EVOLUTION
- Page 8:
© 2004 by Blackwell Science Ltd a
- Page 12:
vi Brief Contents PART 5. MACROEVOL
- Page 16:
viii Full Contents 3.5 Ring “spec
- Page 20:
x Full Contents 7.2 Rates of molecu
- Page 24:
xii Full Contents 10.5 Genetics of
- Page 28:
xiv Full Contents PART 4. EVOLUTION
- Page 32:
xvi Full Contents 14.12 Identificat
- Page 36:
xviii Full Contents 17.7 Geographic
- Page 40:
xx Full Contents 21.4.3 Ordovician
- Page 44:
Preface The theory of evolution is
- Page 48:
xxiv Preface evolve resistance to d
- Page 54:
.. Introduction Part one When Darwi
- Page 60:
4 PART 1 / Introduction Evolution i
- Page 64:
6 PART 1 / Introduction Examples ex
- Page 68:
8 PART 1 / Introduction Time (a) (b
- Page 72:
10 PART 1 / Introduction . . . look
- Page 76:
12 PART 1 / Introduction Time (a) (
- Page 80:
14 PART 1 / Introduction Figure 1.7
- Page 84:
16 PART 1 / Introduction Figure 1.9
- Page 88:
18 PART 1 / Introduction . . . and
- Page 92:
20 PART 1 / Introduction Further re
- Page 96:
22 PART 1 / Introduction DNA is car
- Page 100:
24 PART 1 / Introduction Most genes
- Page 104:
26 PART 1 / Introduction Table 2.1
- Page 108:
28 PART 1 / Introduction Original D
- Page 112:
30 PART 1 / Introduction (a) Transp
- Page 116:
32 PART 1 / Introduction . . . per
- Page 120:
34 PART 1 / Introduction Dominance
- Page 124:
36 PART 1 / Introduction Figure 2.9
- Page 128:
38 PART 1 / Introduction Figure 2.1
- Page 132:
Figure 2.11 Two populations with 10
- Page 136:
42 PART 1 / Introduction Study and
- Page 140:
44 PART 1 / Introduction Life could
- Page 144:
46 PART 1 / Introduction Figure 3.2
- Page 148:
48 PART 1 / Introduction Tooth qual
- Page 152:
50 PART 1 / Introduction Artificial
- Page 156:
52 PART 1 / Introduction Ring speci
- Page 160:
54 PART 1 / Introduction Human obse
- Page 164:
56 PART 1 / Introduction Figure 3.6
- Page 168:
58 PART 1 / Introduction 5' pG Anti
- Page 172:
60 PART 1 / Introduction Figure 3.9
- Page 176:
62 PART 1 / Introduction (a) α-hem
- Page 180:
64 PART 1 / Introduction Age (Myr a
- Page 184:
66 PART 1 / Introduction The groups
- Page 188:
68 PART 1 / Introduction The scient
- Page 192:
70 PART 1 / Introduction Study and
- Page 196:
Plate 3 Here in the lower row are s
- Page 200:
Plate 6 Scrub jays (Aphelocoma coer
- Page 204:
Plate 8 Chromosomal races of the ho
- Page 208:
Plate 10 Geological map of North Am
- Page 212:
72 PART 1 / Introduction Cod produc
- Page 216:
74 PART 1 / Introduction The strugg
- Page 220:
76 PART 1 / Introduction Many chara
- Page 224:
78 PART 1 / Introduction Figure 4.3
- Page 228:
80 PART 1 / Introduction Figure 4.5
- Page 232:
82 PART 1 / Introduction Chromosome
- Page 236:
84 PART 1 / Introduction . . . and
- Page 240:
86 PART 1 / Introduction The condit
- Page 244:
88 PART 1 / Introduction . . . and
- Page 248:
90 PART 1 / Introduction Summary 1
- Page 254:
.. Evolutionary Genetics Part two T
- Page 258:
.. 5 The Theory of Natural Selectio
- Page 262:
.. Figure 5.1 The general model of
- Page 266:
.. . . . and use Mendel’s rules t
- Page 270:
.. A simpler proof of the Hardy- We
- Page 274:
.. The MN human blood group system
- Page 278:
.. CHAPTER 5 / The Theory of Natura
- Page 282:
.. We need to know more to understa
- Page 286:
.. Figure 5.4 Peppered moths natura
- Page 290:
.. Mark-recapture experiments sugge
- Page 294:
.. Manchester The fitness estimates
- Page 298:
.. Pests, such as mosquitoes, evolv
- Page 302:
.. Figure 5.8 The mortality of mosq
- Page 306:
.. Box 5.2 Resistance Management Th
- Page 310:
.. Other factors will be at work in
- Page 314:
.. . . . which can sometimes be use
- Page 318:
.. Figure 5.9 The global incidence
- Page 322:
.. In host-parasite relations, the
- Page 326:
.. Populations may be subdivided CH
- Page 330:
.. We construct a model of gene fre
- Page 334:
.. We construct a model of selectio
- Page 338:
.. Further reading CHAPTER 5 / The
- Page 342:
.. 6 Random Events in Population Ge
- Page 346:
.. Box 6.1 Random Sampling in Genet
- Page 350:
.. Probability of polymorphism 1.0
- Page 354:
.. Evolution can occur by random dr
- Page 358:
.. Random drift has consequences fo
- Page 362:
.. Generation 1 Generation2 Adults
- Page 366:
.. CHAPTER 6 / Random Events in Pop
- Page 370:
.. Heterozygosity ( H ) 1.0 0.9 0.8
- Page 374:
.. Summary 1 In a small population,
- Page 378:
.. 7 Natural Selection and Random D
- Page 382:
.. Two extreme views b selectionist
- Page 386:
.. The original neutral theory has
- Page 390:
.. . . . and levels of polymorphism
- Page 394:
.. homozygotes by normal Mendelian
- Page 398:
.. Amino acid differences 1.0 0.9 0
- Page 402:
.. Globin evolution in “living fo
- Page 406:
.. Long-generation species, e.g., w
- Page 410:
.. Observed heterozygosity 1.0 0.8
- Page 414:
.. The nearly neutral theory can ex
- Page 418:
.. Insulin illustrates the effect o
- Page 422:
.. CHAPTER 7 / Natural Selection an
- Page 426:
.. Biologists came to accept, throu
- Page 430:
.. Elevated dN/dS ratios are observ
- Page 434:
.. Box 7.4 Model Organisms for Biom
- Page 438:
.. But the test has proved illumina
- Page 442:
.. Evidence shows that synonymous c
- Page 446:
.. The genomic era is allowing new
- Page 450:
.. Summary 1 The neutral theory of
- Page 454:
.. Study and review questions 1 Dra
- Page 458:
.. The tiger swallowtail butterfly
- Page 462:
.. Mimicry requires the correct com
- Page 466:
.. A haplotype is a haploid combina
- Page 470:
.. Linkage disequilibrium ( D) r =
- Page 474:
.. The more complex multilocus mode
- Page 478:
.. Expected frequency ( piqi ) (a)
- Page 482:
.. A model of haplotype frequency c
- Page 486:
.. Evidence for linkage disequilibr
- Page 490:
.. (proportion of polymorphic sites
- Page 494:
.. CHAPTER 8 / Two-locus and Multil
- Page 498:
.. Adaptive topographies can be use
- Page 502:
.. Mean population fitness ( w ) -
- Page 506:
.. p' 0 1 0 Frequency of A allele S
- Page 510:
.. Study and review questions 1 Her
- Page 514:
.. Beak size influences feeding eff
- Page 518:
.. Population size Seed √depth ×
- Page 522:
.. Continuous characters are influe
- Page 526:
.. Genetic and environmental influe
- Page 530:
.. Several non-additive genetic fac
- Page 534:
.. Box 9.1 Some Statistical Terms U
- Page 538:
.. Parent-offspring similarity depe
- Page 542:
.. Frequency Frequency Generation 1
- Page 546:
.. New variation can be introduced
- Page 550:
.. (a) 1976-1977 (b) 1981-1982 (c)
- Page 554:
.. Figure 9.11 (a) The main veins i
- Page 558:
.. Certain non-linear relations can
- Page 562:
.. Behavior Physiology Life history
- Page 566:
.. Some heritable characters do not
- Page 570:
.. Further reading CHAPTER 9 / Quan
- Page 574:
.. Adaptation and Natural Selection
- Page 578:
.. 10Adaptive Explanation T his cha
- Page 582:
.. . . . factually, ... . . . or th
- Page 586:
.. Not all evolution is adaptive CH
- Page 590:
.. Figure 10.2 Stages in the evolut
- Page 594:
.. Some critics suggest that the in
- Page 598:
.. Box 10.1 Molecular Cooption The
- Page 602:
.. Fitness (a) (b) Small mutation L
- Page 606:
.. Figure 10.5 A cross between the
- Page 610:
.. . . . by experiment, ... . . . a
- Page 614:
.. Figure 10.6 The fruits of (a) Cr
- Page 618:
.. Heterozygous advantage may lead
- Page 622:
.. Figure 10.7 Developmental asymme
- Page 626:
.. . . . that can be tested between
- Page 630:
.. Fitness (a) Time 1 (b) Time 2 (c
- Page 634:
.. Fitness Fitness (a) Time 1 (c) T
- Page 638:
.. Imperfect adaptations may or may
- Page 642:
.. The “design” of an eye for s
- Page 646:
.. hypothesis of adaptation or cons
- Page 650:
.. Study and review questions 1 Wha
- Page 654:
.. An adaptation may benefit one le
- Page 658:
.. The sd gene gains an advantage f
- Page 662:
.. CHAPTER 11 / The Units of Select
- Page 666:
.. We define Hamilton’s rule Hami
- Page 670:
.. Kin selection is at work in this
- Page 674:
.. Selfish The theories of group se
- Page 678:
.. Box 11.1 Group Selection for Egg
- Page 682:
.. The unit of selection, in a seco
- Page 686:
.. * * The word “gene” is being
- Page 690:
.. Summary 1 Adaptations evolve by
- Page 694:
.. in Sexual Reproduction 12Adaptat
- Page 698:
.. Figure 12.2 Non-reproductive sex
- Page 702:
.. Figure 12.3 Evolution in (a) ase
- Page 706:
.. Asexual reproduction has a spind
- Page 710:
.. . . . as illustrated by a motor
- Page 714:
.. Log fitness of organisms Number
- Page 718:
.. Figure 12.7 Frequency changes of
- Page 722:
.. Genetic cycles in snails are con
- Page 726:
.. Darwin provided comparative evid
- Page 730:
.. . . . which may explain extreme
- Page 734:
.. Theory requires open-ended choic
- Page 738:
.. But selection may have removed h
- Page 742:
.. Courtship bouts Net reproductive
- Page 746:
.. Theory predicts deviations from
- Page 750:
.. CHAPTER 12 / Adaptations in Sexu
- Page 754:
.. Study and review questions 1 Wha
- Page 760:
346 PART 4 / Evolution and Diversit
- Page 764:
348 PART 4 / Evolution and Diversit
- Page 768:
350 PART 4 / Evolution and Diversit
- Page 772:
352 PART 4 / Evolution and Diversit
- Page 776:
354 PART 4 / Evolution and Diversit
- Page 780:
356 PART 4 / Evolution and Diversit
- Page 784:
358 PART 4 / Evolution and Diversit
- Page 788:
360 PART 4 / Evolution and Diversit
- Page 792:
362 PART 4 / Evolution and Diversit
- Page 796:
364 PART 4 / Evolution and Diversit
- Page 800:
366 PART 4 / Evolution and Diversit
- Page 804:
368 PART 4 / Evolution and Diversit
- Page 808:
370 PART 4 / Evolution and Diversit
- Page 812:
372 PART 4 / Evolution and Diversit
- Page 816:
374 PART 4 / Evolution and Diversit
- Page 820:
376 PART 4 / Evolution and Diversit
- Page 824:
378 PART 4 / Evolution and Diversit
- Page 828:
380 PART 4 / Evolution and Diversit
- Page 832:
382 PART 4 / Evolution and Diversit
- Page 836:
384 PART 4 / Evolution and Diversit
- Page 840:
386 PART 4 / Evolution and Diversit
- Page 844:
388 PART 4 / Evolution and Diversit
- Page 848:
390 PART 4 / Evolution and Diversit
- Page 852:
392 PART 4 / Evolution and Diversit
- Page 856:
394 PART 4 / Evolution and Diversit
- Page 860:
396 PART 4 / Evolution and Diversit
- Page 864:
398 PART 4 / Evolution and Diversit
- Page 868:
400 PART 4 / Evolution and Diversit
- Page 872:
402 PART 4 / Evolution and Diversit
- Page 876:
404 PART 4 / Evolution and Diversit
- Page 880:
406 PART 4 / Evolution and Diversit
- Page 884:
408 PART 4 / Evolution and Diversit
- Page 888:
410 PART 4 / Evolution and Diversit
- Page 892:
412 PART 4 / Evolution and Diversit
- Page 896:
414 PART 4 / Evolution and Diversit
- Page 900:
416 PART 4 / Evolution and Diversit
- Page 904:
418 PART 4 / Evolution and Diversit
- Page 908:
420 PART 4 / Evolution and Diversit
- Page 912:
422 PART 4 / Evolution and Diversit
- Page 916:
424 PART 4 / Evolution and Diversit
- Page 920:
426 PART 4 / Evolution and Diversit
- Page 924:
428 PART 4 / Evolution and Diversit
- Page 928:
430 PART 4 / Evolution and Diversit
- Page 932:
432 PART 4 / Evolution and Diversit
- Page 936:
434 PART 4 / Evolution and Diversit
- Page 940:
436 PART 4 / Evolution and Diversit
- Page 944:
438 PART 4 / Evolution and Diversit
- Page 948:
440 PART 4 / Evolution and Diversit
- Page 952:
442 PART 4 / Evolution and Diversit
- Page 956:
444 PART 4 / Evolution and Diversit
- Page 960:
446 PART 4 / Evolution and Diversit
- Page 964:
448 PART 4 / Evolution and Diversit
- Page 968:
450 PART 4 / Evolution and Diversit
- Page 972:
452 PART 4 / Evolution and Diversit
- Page 976:
454 PART 4 / Evolution and Diversit
- Page 980:
456 PART 4 / Evolution and Diversit
- Page 984:
458 PART 4 / Evolution and Diversit
- Page 988:
460 PART 4 / Evolution and Diversit
- Page 992:
462 PART 4 / Evolution and Diversit
- Page 996:
464 PART 4 / Evolution and Diversit
- Page 1000:
466 PART 4 / Evolution and Diversit
- Page 1004:
468 PART 4 / Evolution and Diversit
- Page 1008:
470 PART 4 / Evolution and Diversit
- Page 1012:
472 PART 4 / Evolution and Diversit
- Page 1016:
474 PART 4 / Evolution and Diversit
- Page 1020:
476 PART 4 / Evolution and Diversit
- Page 1024:
478 PART 4 / Evolution and Diversit
- Page 1028:
480 PART 4 / Evolution and Diversit
- Page 1032:
482 PART 4 / Evolution and Diversit
- Page 1036:
484 PART 4 / Evolution and Diversit
- Page 1040:
486 PART 4 / Evolution and Diversit
- Page 1044:
488 PART 4 / Evolution and Diversit
- Page 1048:
490 PART 4 / Evolution and Diversit
- Page 1052:
17Evolutionary Biogeography B iogeo
- Page 1056:
494 PART 4 / Evolution and Diversit
- Page 1060:
496 PART 4 / Evolution and Diversit
- Page 1064:
498 PART 4 / Evolution and Diversit
- Page 1068:
500 PART 4 / Evolution and Diversit
- Page 1072:
502 PART 4 / Evolution and Diversit
- Page 1076:
504 PART 4 / Evolution and Diversit
- Page 1080:
506 PART 4 / Evolution and Diversit
- Page 1084:
508 PART 4 / Evolution and Diversit
- Page 1088:
510 PART 4 / Evolution and Diversit
- Page 1092:
512 PART 4 / Evolution and Diversit
- Page 1096:
514 PART 4 / Evolution and Diversit
- Page 1100:
516 PART 4 / Evolution and Diversit
- Page 1104:
518 PART 4 / Evolution and Diversit
- Page 1108:
520 PART 4 / Evolution and Diversit
- Page 1112:
522 PART 5 / Macroevolution looked
- Page 1116:
524 PART 5 / Macroevolution Fossili
- Page 1120:
526 PART 5 / Macroevolution Era Per
- Page 1124:
528 PART 5 / Macroevolution N = N 0
- Page 1128:
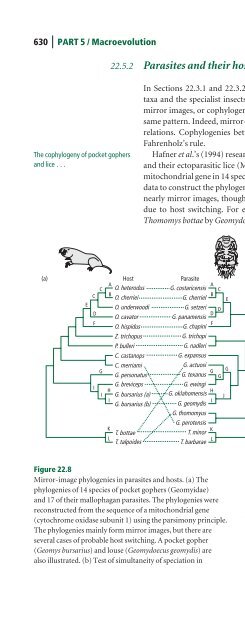
530 PART 5 / Macroevolution Early l
- Page 1132:
532 PART 5 / Macroevolution Cells h
- Page 1138:
.. Multicellular life originated ov
- Page 1142:
.. Present ~540 Myr ~1,200 Myr Echi
- Page 1146:
.. Figure 18.8 The rise of the angi
- Page 1150:
.. Figure 18.9 The origin of tetrap
- Page 1154:
.. Probainognathus Thrinaxodon Proc
- Page 1158:
.. . . . and cynodonts but their te
- Page 1162:
.. . . . and sexual dimorphism all
- Page 1166:
.. Homo sapiens c. 100,000 years ag
- Page 1170:
.. Macroevolution may be due to ext
- Page 1174:
.. Summary 1 Fossils are formed whe
- Page 1178:
.. Study and review questions 1 Rev
- Page 1182:
.. Evolutionary genomics aims to an
- Page 1186:
.. Figure 19.1 The history of the h
- Page 1190:
.. (a) A (b) 2 1 B C Vertebrate 1 2
- Page 1194:
.. Following symbiosis ... . . . ge
- Page 1198:
.. X and Y chromosomes evolve apart
- Page 1202:
.. Figure 19.5 (a) A chromosomal in
- Page 1206:
.. Mice do not show the same patter
- Page 1210:
.. Study and review questions 1 (a)
- Page 1214:
.. Morphological evolution is drive
- Page 1218:
.. Figure 20.2 (a) Evolution by ter
- Page 1222:
.. Developmental change can be by h
- Page 1226:
.. . . . than might be expected fro
- Page 1230:
.. A similar gene works in eye deve
- Page 1234:
.. Figure 20.6 History of the Hox g
- Page 1238:
.. Changes in arthropod limbs are a
- Page 1242:
.. Switching systems may have made
- Page 1246:
.. Study and review questions 1 If
- Page 1250:
.. Horse teeth are an example of ho
- Page 1254:
.. Horse teeth show a representativ
- Page 1258:
.. Figure 21.2 Possible phylogeny o
- Page 1262:
.. Figure 21.3 The relation between
- Page 1266:
.. . . . disappear after the measur
- Page 1270:
.. Box 21.1 Two Meanings of Gradual
- Page 1274:
.. Time Punctuated equilibrium extr
- Page 1278: .. Time General younging direction
- Page 1282: .. Score Change in score per millio
- Page 1286: .. Time (Myr) Two species/million y
- Page 1290: .. Summary CHAPTER 21 / Rates of Ev
- Page 1294: .. 22Coevolution C oevolution happe
- Page 1298: .. Figure 22.2 Coevolution means th
- Page 1302: .. Pollinator relationships have le
- Page 1306: .. (a) Time Character Plant Insect
- Page 1310: .. (a) Plant ( Bursera ) sarukhanii
- Page 1314: .. Abiotic pollination Biotic polli
- Page 1318: .. Myxomatosis reduced rabbit popul
- Page 1322: .. Virulence depends on ... . . . t
- Page 1326: .. lower Virulence higher 1.1 1.0 0
- Page 1332: 632 PART 5 / Macroevolution Figure
- Page 1336: 634 PART 5 / Macroevolution Carnivo
- Page 1340: 636 PART 5 / Macroevolution Figure
- Page 1344: 638 PART 5 / Macroevolution Number
- Page 1348: 640 PART 5 / Macroevolution Coevolu
- Page 1352: 642 PART 5 / Macroevolution Study a
- Page 1356: 644 PART 5 / Macroevolution Adaptiv
- Page 1360: 646 PART 5 / Macroevolution Extinct
- Page 1364: 648 PART 5 / Macroevolution . . . b
- Page 1368: Tertiary Lower Danian Cretaceous Up
- Page 1372: 652 PART 5 / Macroevolution The ast
- Page 1376: 654 PART 5 / Macroevolution 10 6 ye
- Page 1380:
656 PART 5 / Macroevolution Extinct
- Page 1384:
658 PART 5 / Macroevolution Darwin
- Page 1388:
660 PART 5 / Macroevolution (a) Ext
- Page 1392:
662 PART 5 / Macroevolution Figure
- Page 1396:
664 PART 5 / Macroevolution Hansen
- Page 1400:
666 PART 5 / Macroevolution Taxa wi
- Page 1404:
668 PART 5 / Macroevolution Fossil
- Page 1408:
670 PART 5 / Macroevolution One gro
- Page 1412:
672 PART 5 / Macroevolution Molecul
- Page 1416:
674 PART 5 / Macroevolution Changes
- Page 1420:
676 PART 5 / Macroevolution . . . o
- Page 1424:
678 PART 5 / Macroevolution Summary
- Page 1428:
680 PART 5 / Macroevolution (2002),
- Page 1432:
Glossary Words in italics cross-ref
- Page 1436:
684 Glossary individuals, such as p
- Page 1440:
686 Glossary isolating mechanism An
- Page 1444:
688 Glossary random drift Synonym o
- Page 1448:
Answers to Study and Review Questio
- Page 1452:
692 Answers to Study and Review Que
- Page 1456:
694 Answers to Study and Review Que
- Page 1460:
696 Answers to Study and Review Que
- Page 1464:
698 Answers to Study and Review Que
- Page 1468:
700 References Arnold, M.L. (1997).
- Page 1472:
702 References Briggs, D.E.G. & Cro
- Page 1476:
704 References Clarke, C.A., Sheppa
- Page 1480:
706 References Dietl, G.P., Alexand
- Page 1484:
708 References Flynn, J.J. & Wyss,
- Page 1488:
710 References Grant, P.R. & Grant,
- Page 1492:
712 References Hey, J. (2001). Gene
- Page 1496:
714 References Jeffreys, A.J., Royl
- Page 1500:
716 References Kruuk, L.E.B., Meril
- Page 1504:
718 References MacFadden, B.J. (199
- Page 1508:
720 References Milinkovitch, M.C.,
- Page 1512:
722 References Orr, H.A. (1998). Th
- Page 1516:
724 References Rice, W.R. (2002). E
- Page 1520:
726 References Sequeira, A.S., Lant
- Page 1524:
728 References Surlyk, F. & Johanse
- Page 1528:
730 References Vrba, E.S. (1993). T
- Page 1532:
732 References Wright, S. (1977). E
- Page 1536:
734 Index angiosperms (cont.): inse
- Page 1540:
736 Index coloration (cont.): prezy
- Page 1544:
738 Index evolution (cont.): long-t
- Page 1548:
740 Index genetics (cont.): charact
- Page 1552:
742 Index immunoglobulins 24 immuno
- Page 1556:
744 Index molecular distance 440-2
- Page 1560:
746 Index parasites (cont.): genome
- Page 1564:
748 Index reproductive development
- Page 1568:
750 Index synonymous changes (cont.