- Page 2:
.. EVOLUTION
- Page 8:
© 2004 by Blackwell Science Ltd a
- Page 12:
vi Brief Contents PART 5. MACROEVOL
- Page 16:
viii Full Contents 3.5 Ring “spec
- Page 20:
x Full Contents 7.2 Rates of molecu
- Page 24:
xii Full Contents 10.5 Genetics of
- Page 28:
xiv Full Contents PART 4. EVOLUTION
- Page 32:
xvi Full Contents 14.12 Identificat
- Page 36:
xviii Full Contents 17.7 Geographic
- Page 40:
xx Full Contents 21.4.3 Ordovician
- Page 44:
Preface The theory of evolution is
- Page 48:
xxiv Preface evolve resistance to d
- Page 54:
.. Introduction Part one When Darwi
- Page 60:
4 PART 1 / Introduction Evolution i
- Page 64:
6 PART 1 / Introduction Examples ex
- Page 68:
8 PART 1 / Introduction Time (a) (b
- Page 72:
10 PART 1 / Introduction . . . look
- Page 76:
12 PART 1 / Introduction Time (a) (
- Page 80:
14 PART 1 / Introduction Figure 1.7
- Page 84:
16 PART 1 / Introduction Figure 1.9
- Page 88:
18 PART 1 / Introduction . . . and
- Page 92:
20 PART 1 / Introduction Further re
- Page 96:
22 PART 1 / Introduction DNA is car
- Page 100:
24 PART 1 / Introduction Most genes
- Page 104:
26 PART 1 / Introduction Table 2.1
- Page 108:
28 PART 1 / Introduction Original D
- Page 112:
30 PART 1 / Introduction (a) Transp
- Page 116:
32 PART 1 / Introduction . . . per
- Page 120:
34 PART 1 / Introduction Dominance
- Page 124:
36 PART 1 / Introduction Figure 2.9
- Page 128:
38 PART 1 / Introduction Figure 2.1
- Page 132:
Figure 2.11 Two populations with 10
- Page 136:
42 PART 1 / Introduction Study and
- Page 140:
44 PART 1 / Introduction Life could
- Page 144:
46 PART 1 / Introduction Figure 3.2
- Page 148:
48 PART 1 / Introduction Tooth qual
- Page 152:
50 PART 1 / Introduction Artificial
- Page 156:
52 PART 1 / Introduction Ring speci
- Page 160:
54 PART 1 / Introduction Human obse
- Page 164:
56 PART 1 / Introduction Figure 3.6
- Page 168:
58 PART 1 / Introduction 5' pG Anti
- Page 172:
60 PART 1 / Introduction Figure 3.9
- Page 176:
62 PART 1 / Introduction (a) α-hem
- Page 180:
64 PART 1 / Introduction Age (Myr a
- Page 184:
66 PART 1 / Introduction The groups
- Page 188:
68 PART 1 / Introduction The scient
- Page 192:
70 PART 1 / Introduction Study and
- Page 196:
Plate 3 Here in the lower row are s
- Page 200:
Plate 6 Scrub jays (Aphelocoma coer
- Page 204:
Plate 8 Chromosomal races of the ho
- Page 208:
Plate 10 Geological map of North Am
- Page 212:
72 PART 1 / Introduction Cod produc
- Page 216:
74 PART 1 / Introduction The strugg
- Page 220:
76 PART 1 / Introduction Many chara
- Page 224:
78 PART 1 / Introduction Figure 4.3
- Page 228: 80 PART 1 / Introduction Figure 4.5
- Page 232: 82 PART 1 / Introduction Chromosome
- Page 236: 84 PART 1 / Introduction . . . and
- Page 240: 86 PART 1 / Introduction The condit
- Page 244: 88 PART 1 / Introduction . . . and
- Page 248: 90 PART 1 / Introduction Summary 1
- Page 254: .. Evolutionary Genetics Part two T
- Page 258: .. 5 The Theory of Natural Selectio
- Page 262: .. Figure 5.1 The general model of
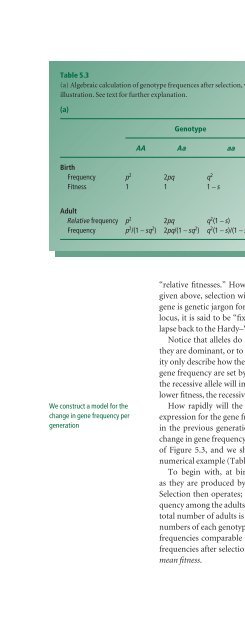
- Page 266: .. . . . and use Mendel’s rules t
- Page 270: .. A simpler proof of the Hardy- We
- Page 274: .. The MN human blood group system
- Page 280: 106 PART 2 / Evolutionary Genetics
- Page 284: 108 PART 2 / Evolutionary Genetics
- Page 288: 110 PART 2 / Evolutionary Genetics
- Page 292: 112 PART 2 / Evolutionary Genetics
- Page 296: 114 PART 2 / Evolutionary Genetics
- Page 300: 116 PART 2 / Evolutionary Genetics
- Page 304: 118 PART 2 / Evolutionary Genetics
- Page 308: 120 PART 2 / Evolutionary Genetics
- Page 312: 122 PART 2 / Evolutionary Genetics
- Page 316: 124 PART 2 / Evolutionary Genetics
- Page 320: 126 PART 2 / Evolutionary Genetics
- Page 324: 128 PART 2 / Evolutionary Genetics
- Page 328:
130 PART 2 / Evolutionary Genetics
- Page 332:
132 PART 2 / Evolutionary Genetics
- Page 336:
134 PART 2 / Evolutionary Genetics
- Page 340:
136 PART 2 / Evolutionary Genetics
- Page 344:
138 PART 2 / Evolutionary Genetics
- Page 348:
140 PART 2 / Evolutionary Genetics
- Page 352:
142 PART 2 / Evolutionary Genetics
- Page 356:
144 PART 2 / Evolutionary Genetics
- Page 360:
146 PART 2 / Evolutionary Genetics
- Page 364:
148 PART 2 / Evolutionary Genetics
- Page 368:
150 PART 2 / Evolutionary Genetics
- Page 372:
152 PART 2 / Evolutionary Genetics
- Page 376:
154 PART 2 / Evolutionary Genetics
- Page 380:
156 PART 2 / Evolutionary Genetics
- Page 384:
158 PART 2 / Evolutionary Genetics
- Page 388:
160 PART 2 / Evolutionary Genetics
- Page 392:
162 PART 2 / Evolutionary Genetics
- Page 396:
164 PART 2 / Evolutionary Genetics
- Page 400:
Box 7.2 The Relative Rate Test The
- Page 404:
168 PART 2 / Evolutionary Genetics
- Page 408:
170 PART 2 / Evolutionary Genetics
- Page 412:
172 PART 2 / Evolutionary Genetics
- Page 416:
174 PART 2 / Evolutionary Genetics
- Page 420:
176 PART 2 / Evolutionary Genetics
- Page 424:
178 PART 2 / Evolutionary Genetics
- Page 428:
180 PART 2 / Evolutionary Genetics
- Page 432:
182 PART 2 / Evolutionary Genetics
- Page 436:
184 PART 2 / Evolutionary Genetics
- Page 440:
186 PART 2 / Evolutionary Genetics
- Page 444:
188 PART 2 / Evolutionary Genetics
- Page 448:
190 PART 2 / Evolutionary Genetics
- Page 452:
192 PART 2 / Evolutionary Genetics
- Page 456:
8 Two-locus and Multilocus Populati
- Page 460:
196 PART 2 / Evolutionary Genetics
- Page 464:
198 PART 2 / Evolutionary Genetics
- Page 468:
200 PART 2 / Evolutionary Genetics
- Page 472:
202 PART 2 / Evolutionary Genetics
- Page 476:
204 PART 2 / Evolutionary Genetics
- Page 480:
206 PART 2 / Evolutionary Genetics
- Page 484:
208 PART 2 / Evolutionary Genetics
- Page 488:
210 PART 2 / Evolutionary Genetics
- Page 492:
212 PART 2 / Evolutionary Genetics
- Page 496:
214 PART 2 / Evolutionary Genetics
- Page 500:
216 PART 2 / Evolutionary Genetics
- Page 504:
218 PART 2 / Evolutionary Genetics
- Page 508:
220 PART 2 / Evolutionary Genetics
- Page 512:
9 Quantitative Genetics T he Mendel
- Page 516:
224 PART 2 / Evolutionary Genetics
- Page 520:
226 PART 2 / Evolutionary Genetics
- Page 524:
228 PART 2 / Evolutionary Genetics
- Page 528:
230 PART 2 / Evolutionary Genetics
- Page 532:
232 PART 2 / Evolutionary Genetics
- Page 536:
234 PART 2 / Evolutionary Genetics
- Page 540:
236 PART 2 / Evolutionary Genetics
- Page 544:
238 PART 2 / Evolutionary Genetics
- Page 548:
240 PART 2 / Evolutionary Genetics
- Page 552:
242 PART 2 / Evolutionary Genetics
- Page 556:
244 PART 2 / Evolutionary Genetics
- Page 560:
246 PART 2 / Evolutionary Genetics
- Page 564:
248 PART 2 / Evolutionary Genetics
- Page 568:
250 PART 2 / Evolutionary Genetics
- Page 572:
252 PART 2 / Evolutionary Genetics
- Page 576:
254 PART 3 / Adaptation and Natural
- Page 580:
256 PART 3 / Adaptation and Natural
- Page 584:
258 PART 3 / Adaptation and Natural
- Page 588:
260 PART 3 / Adaptation and Natural
- Page 592:
262 PART 3 / Adaptation and Natural
- Page 596:
264 PART 3 / Adaptation and Natural
- Page 600:
266 PART 3 / Adaptation and Natural
- Page 604:
268 PART 3 / Adaptation and Natural
- Page 608:
270 PART 3 / Adaptation and Natural
- Page 612:
272 PART 3 / Adaptation and Natural
- Page 616:
274 PART 3 / Adaptation and Natural
- Page 620:
276 PART 3 / Adaptation and Natural
- Page 624:
278 PART 3 / Adaptation and Natural
- Page 628:
280 PART 3 / Adaptation and Natural
- Page 632:
282 PART 3 / Adaptation and Natural
- Page 636:
284 PART 3 / Adaptation and Natural
- Page 640:
286 PART 3 / Adaptation and Natural
- Page 644:
288 PART 3 / Adaptation and Natural
- Page 648:
290 PART 3 / Adaptation and Natural
- Page 652:
11The Units of Selection A daptatio
- Page 656:
294 PART 3 / Adaptation and Natural
- Page 660:
296 PART 3 / Adaptation and Natural
- Page 664:
298 PART 3 / Adaptation and Natural
- Page 668:
300 PART 3 / Adaptation and Natural
- Page 672:
302 PART 3 / Adaptation and Natural
- Page 676:
304 PART 3 / Adaptation and Natural
- Page 680:
306 PART 3 / Adaptation and Natural
- Page 684:
308 PART 3 / Adaptation and Natural
- Page 688:
310 PART 3 / Adaptation and Natural
- Page 692:
312 PART 3 / Adaptation and Natural
- Page 696:
314 PART 3 / Adaptation and Natural
- Page 700:
316 PART 3 / Adaptation and Natural
- Page 704:
318 PART 3 / Adaptation and Natural
- Page 708:
320 PART 3 / Adaptation and Natural
- Page 712:
322 PART 3 / Adaptation and Natural
- Page 716:
324 PART 3 / Adaptation and Natural
- Page 720:
Frequency Frequency Frequency Frequ
- Page 724:
328 PART 3 / Adaptation and Natural
- Page 728:
330 PART 3 / Adaptation and Natural
- Page 732:
332 PART 3 / Adaptation and Natural
- Page 736:
334 PART 3 / Adaptation and Natural
- Page 740:
336 PART 3 / Adaptation and Natural
- Page 744:
338 PART 3 / Adaptation and Natural
- Page 748:
340 PART 3 / Adaptation and Natural
- Page 752:
342 PART 3 / Adaptation and Natural
- Page 758:
.. Evolution and Diversity Darwin c
- Page 762:
.. Concepts and Intraspecific Varia
- Page 766:
.. CHAPTER 13 / Species Concepts an
- Page 770:
.. Time Vertical species concept Sp
- Page 774:
.. Species may be defined ecologica
- Page 778:
.. . . . and there are other, moder
- Page 782:
.. . . . that has been shown by rec
- Page 786:
.. We have good evidence of geograp
- Page 790:
.. Geographic variation in mice chr
- Page 794:
.. In a stepped cline, the gradient
- Page 798:
.. Box 13.2 Human Variation and Hum
- Page 802:
.. Figure 13.7 Character displaceme
- Page 806:
.. Polytypic species have diverse p
- Page 810:
.. (a) (b) (c) Gave de Pau Gave d
- Page 814:
.. Ecological factors can influence
- Page 818:
.. Biological species are real, not
- Page 822:
.. Biologists disagree about how re
- Page 826:
.. CHAPTER 13 / Species Concepts an
- Page 830:
.. 14Speciation S peciation means t
- Page 834:
.. (a) Space (b) (c) Time Geographi
- Page 838:
.. Figure 14.2 Prezygotic isolation
- Page 842:
.. Figure 14.3 Song form may be ple
- Page 846:
.. Could postzygotic isolation evol
- Page 850:
.. Hybrid fitness is influenced by
- Page 854:
.. Diploid genotype Gene duplicatio
- Page 858:
.. . . . in exceptional conditions
- Page 862:
.. Fitness of hybrid offspring Fitn
- Page 866:
.. Speciation often occurs as a byp
- Page 870:
.. The theory of reinforcement has
- Page 874:
.. Less interbreeding between speci
- Page 878:
.. . . . but also open to alternati
- Page 882:
.. Figure 14.11 Hybrid speciation b
- Page 886:
.. Reinforcement works in sympatry
- Page 890:
.. Most hybrid zones are due to sec
- Page 894:
.. Phylogenetic tests for sympatric
- Page 898:
.. This is a “hot topic” The Od
- Page 902:
.. Biologists are interested in the
- Page 906:
.. Summary 1 The evolution of a new
- Page 910:
.. CHAPTER 14 / Speciation 421 On r
- Page 914:
.. Reconstruction of Phylogeny 15Th
- Page 918:
.. Shared characters are used to in
- Page 922:
.. Figure 15.2 Character conflict i
- Page 926:
.. Figure 15.4 Convergence in marsu
- Page 930:
.. We distinguish ancestral from de
- Page 934:
.. Figure 15.7 Shared characters di
- Page 938:
.. Parsimony underlies outgroup com
- Page 942:
.. Protein and DNA sequences have b
- Page 946:
.. Molecular phylogenetics uses sta
- Page 950:
.. Figure 15.11 Distance methods. (
- Page 954:
.. Percentage difference in DNA of
- Page 958:
.. When two species are very differ
- Page 962:
.. Figure 15.15 The same character
- Page 966:
.. Variable evolutionary rates upse
- Page 970:
.. Ribosomal RNA genes are widely u
- Page 974:
.. The number of possible trees can
- Page 978:
.. . . . as happened in one study o
- Page 982:
.. Evolutionary time Species 1 Orth
- Page 986:
.. The root of a tree ... . . . can
- Page 990:
.. Figure 15.24 The rooted angiospe
- Page 994:
.. The fossil characters were reint
- Page 998:
.. Figure 15.27 Phylogeny of 103 sp
- Page 1002:
.. Summary 1 Phylogenies show the a
- Page 1006:
.. Study and review questions 1 Her
- Page 1010:
.. 16Classification and Evolution B
- Page 1014:
.. Phenetic classification is nonev
- Page 1018:
.. CHAPTER 16 / Classification and
- Page 1022:
.. (a) Phenetic measurements for fi
- Page 1026:
.. Distance can be measured in more
- Page 1030:
.. Cladism admits only monophyletic
- Page 1034:
.. Phylogenetic classification face
- Page 1038:
.. Evolutionary classification admi
- Page 1042:
.. Classification 1 Classification
- Page 1046:
.. Other factors are probably at wo
- Page 1050:
.. Study and review questions 1 Mat
- Page 1054:
.. Figure 17.1 The natural distribu
- Page 1058:
.. Figure 17.2 (a) The six main fau
- Page 1062:
.. Dispersal is enabled by various
- Page 1066:
.. Many species show similar geneti
- Page 1070:
.. Figure 17.4 (b) The three major
- Page 1074:
.. Fruitflies and lizards show a co
- Page 1078:
.. Plate tectonics causes vicarianc
- Page 1082:
.. Time Biogeographic distribution
- Page 1086:
.. Figure 17.11 Testing vicariance
- Page 1090:
.. (b) Five other vertebrate groups
- Page 1094:
.. . . . and South American mammals
- Page 1098:
.. CHAPTER 17 / Evolutionary Biogeo
- Page 1102:
.. The Great American Interchange i
- Page 1106:
.. CHAPTER 17 / Evolutionary Biogeo
- Page 1110:
.. Macroevolution Part five Part 5
- Page 1114:
.. 18The History of Life T his chap
- Page 1118:
.. Geological maps show the locatio
- Page 1122:
.. CHAPTER 18 / The History of Life
- Page 1126:
.. Time (Myr BP) 0.5 1.0 2.0 3.0 4.
- Page 1130:
.. Figure 18.3 Around 2-3 billion y
- Page 1134:
.. . . . partly by symbiosis Atmosp
- Page 1140:
536 PART 5 / Macroevolution Protost
- Page 1144:
538 PART 5 / Macroevolution Plants
- Page 1148:
540 PART 5 / Macroevolution Some ma
- Page 1152:
542 PART 5 / Macroevolution The amn
- Page 1156:
544 PART 5 / Macroevolution Figure
- Page 1160:
546 PART 5 / Macroevolution Changes
- Page 1164:
548 PART 5 / Macroevolution Myr ago
- Page 1168:
550 PART 5 / Macroevolution Genetic
- Page 1172:
552 PART 5 / Macroevolution Figure
- Page 1176:
554 PART 5 / Macroevolution Further
- Page 1180:
19Evolutionary Genomics T he comple
- Page 1184:
558 PART 5 / Macroevolution Some hu
- Page 1188:
560 PART 5 / Macroevolution Molecul
- Page 1192:
562 PART 5 / Macroevolution Superfl
- Page 1196:
564 PART 5 / Macroevolution (a) Gen
- Page 1200:
566 PART 5 / Macroevolution Figure
- Page 1204:
568 PART 5 / Macroevolution Transpo
- Page 1208:
570 PART 5 / Macroevolution Summary
- Page 1212:
Developmental Biology 20Evolutionar
- Page 1216:
574 PART 5 / Macroevolution Figure
- Page 1220:
576 PART 5 / Macroevolution Figure
- Page 1224:
578 PART 5 / Macroevolution Figure
- Page 1228:
580 PART 5 / Macroevolution The Hox
- Page 1232:
582 PART 5 / Macroevolution The num
- Page 1236:
584 PART 5 / Macroevolution Mouse C
- Page 1240:
586 PART 5 / Macroevolution A gene
- Page 1244:
588 PART 5 / Macroevolution Summary
- Page 1248:
21Rates of Evolution E volutionary
- Page 1252:
592 PART 5 / Macroevolution Time (M
- Page 1256:
594 PART 5 / Macroevolution Table 2
- Page 1260:
596 PART 5 / Macroevolution . . . a
- Page 1264:
598 PART 5 / Macroevolution (a) 5 B
- Page 1268:
600 PART 5 / Macroevolution Figure
- Page 1272:
602 PART 5 / Macroevolution Apparen
- Page 1276:
604 PART 5 / Macroevolution Figure
- Page 1280:
606 PART 5 / Macroevolution Discret
- Page 1284:
608 PART 5 / Macroevolution Figure
- Page 1288:
610 PART 5 / Macroevolution Figure
- Page 1292:
612 PART 5 / Macroevolution Further
- Page 1296:
614 PART 5 / Macroevolution Figure
- Page 1300:
616 PART 5 / Macroevolution Full ev
- Page 1304:
618 PART 5 / Macroevolution Figure
- Page 1308:
620 PART 5 / Macroevolution . . . o
- Page 1312:
622 PART 5 / Macroevolution One stu
- Page 1316:
624 PART 5 / Macroevolution Box 22.
- Page 1320:
626 PART 5 / Macroevolution Table 2
- Page 1324:
628 PART 5 / Macroevolution Nematod
- Page 1328:
630 PART 5 / Macroevolution The cop
- Page 1332:
632 PART 5 / Macroevolution Figure
- Page 1336:
634 PART 5 / Macroevolution Carnivo
- Page 1340:
636 PART 5 / Macroevolution Figure
- Page 1344:
638 PART 5 / Macroevolution Number
- Page 1348:
640 PART 5 / Macroevolution Coevolu
- Page 1352:
642 PART 5 / Macroevolution Study a
- Page 1356:
644 PART 5 / Macroevolution Adaptiv
- Page 1360:
646 PART 5 / Macroevolution Extinct
- Page 1364:
648 PART 5 / Macroevolution . . . b
- Page 1368:
Tertiary Lower Danian Cretaceous Up
- Page 1372:
652 PART 5 / Macroevolution The ast
- Page 1376:
654 PART 5 / Macroevolution 10 6 ye
- Page 1380:
656 PART 5 / Macroevolution Extinct
- Page 1384:
658 PART 5 / Macroevolution Darwin
- Page 1388:
660 PART 5 / Macroevolution (a) Ext
- Page 1392:
662 PART 5 / Macroevolution Figure
- Page 1396:
664 PART 5 / Macroevolution Hansen
- Page 1400:
666 PART 5 / Macroevolution Taxa wi
- Page 1404:
668 PART 5 / Macroevolution Fossil
- Page 1408:
670 PART 5 / Macroevolution One gro
- Page 1412:
672 PART 5 / Macroevolution Molecul
- Page 1416:
674 PART 5 / Macroevolution Changes
- Page 1420:
676 PART 5 / Macroevolution . . . o
- Page 1424:
678 PART 5 / Macroevolution Summary
- Page 1428:
680 PART 5 / Macroevolution (2002),
- Page 1432:
Glossary Words in italics cross-ref
- Page 1436:
684 Glossary individuals, such as p
- Page 1440:
686 Glossary isolating mechanism An
- Page 1444:
688 Glossary random drift Synonym o
- Page 1448:
Answers to Study and Review Questio
- Page 1452:
692 Answers to Study and Review Que
- Page 1456:
694 Answers to Study and Review Que
- Page 1460:
696 Answers to Study and Review Que
- Page 1464:
698 Answers to Study and Review Que
- Page 1468:
700 References Arnold, M.L. (1997).
- Page 1472:
702 References Briggs, D.E.G. & Cro
- Page 1476:
704 References Clarke, C.A., Sheppa
- Page 1480:
706 References Dietl, G.P., Alexand
- Page 1484:
708 References Flynn, J.J. & Wyss,
- Page 1488:
710 References Grant, P.R. & Grant,
- Page 1492:
712 References Hey, J. (2001). Gene
- Page 1496:
714 References Jeffreys, A.J., Royl
- Page 1500:
716 References Kruuk, L.E.B., Meril
- Page 1504:
718 References MacFadden, B.J. (199
- Page 1508:
720 References Milinkovitch, M.C.,
- Page 1512:
722 References Orr, H.A. (1998). Th
- Page 1516:
724 References Rice, W.R. (2002). E
- Page 1520:
726 References Sequeira, A.S., Lant
- Page 1524:
728 References Surlyk, F. & Johanse
- Page 1528:
730 References Vrba, E.S. (1993). T
- Page 1532:
732 References Wright, S. (1977). E
- Page 1536:
734 Index angiosperms (cont.): inse
- Page 1540:
736 Index coloration (cont.): prezy
- Page 1544:
738 Index evolution (cont.): long-t
- Page 1548:
740 Index genetics (cont.): charact
- Page 1552:
742 Index immunoglobulins 24 immuno
- Page 1556:
744 Index molecular distance 440-2
- Page 1560:
746 Index parasites (cont.): genome
- Page 1564:
748 Index reproductive development
- Page 1568:
750 Index synonymous changes (cont.