- Page 1 and 2:
247 LABOUR POLICY STUDIES Juha Anti
- Page 4 and 5:
FOREWORD The working life barometer
- Page 6 and 7:
SUMMARY This research study is the
- Page 8:
CONTENTS INTRODUCTION .............
- Page 11 and 12:
2 of the state was part of the deve
- Page 13 and 14:
4 to; and, in fact, it can be very
- Page 15 and 16:
6 PART ONE COUNTRY ESSAYS
- Page 17 and 18:
8 Industries: Food, textile, wearin
- Page 19 and 20:
10 Since the beginning of the 1990s
- Page 21 and 22:
12 As the number of working age pop
- Page 23 and 24:
14 2001 the unemployment rate of th
- Page 25 and 26:
16 In addition to unemployment bene
- Page 27 and 28:
18 the average wage is higher than
- Page 29 and 30:
20 proceeding from its economic opp
- Page 31 and 32:
LATVIA Jevg_nija Sviridenkova Senio
- Page 33 and 34:
24 improved, the institutional set-
- Page 35 and 36:
26 Once a year a taxpayer is allowe
- Page 37 and 38:
28 The legal framework for enterpri
- Page 39 and 40:
30 The aim of economic policy of th
- Page 41 and 42:
32 exchange rate ensures stable pri
- Page 43 and 44:
34 age population will not fall tha
- Page 45 and 46:
36 favourable conditions for invest
- Page 47 and 48:
38 conditions for investment and th
- Page 49 and 50:
40 The key elements of health promo
- Page 51 and 52:
42 Most of the higher educational i
- Page 53 and 54:
44 financial intermediation 96 015
- Page 55 and 56:
LITHUANIA 46 Gintare Buzinskaite Se
- Page 57 and 58:
48 The main legal act is the Consti
- Page 59 and 60:
50 According to the data of the cen
- Page 61 and 62:
52 money transfer from the EU will
- Page 63 and 64:
54 In 1997 the Government of Lithua
- Page 65 and 66:
56 without children had the biggest
- Page 67 and 68:
58 pensioners work. There were 67.7
- Page 69 and 70:
60 The biggest number of job vacanc
- Page 71 and 72:
62 Confederation of Lithuanian Indu
- Page 73 and 74:
64 Lithuania’s economy is growing
- Page 75 and 76:
66 In this section, we will examine
- Page 77 and 78:
68 other two countries, and so the
- Page 79 and 80: 50% 40% 30% 20% 10% 0% 25% 70 UNION
- Page 81 and 82: 72 Trade union representation at th
- Page 83 and 84: 74 In any case, the proportion of u
- Page 85 and 86: 40% 20% 0% -20% -40% 32% -22% 76 OP
- Page 87 and 88: 78 to the trade union movement. In
- Page 89 and 90: 80 working hours, the same things w
- Page 91 and 92: 82 Lithuania. However, only 15 % of
- Page 93 and 94: …at the workplace together with c
- Page 95 and 96: 86 NEGOTIATIONS ON EMPLOYEES' SAFET
- Page 97 and 98: 88 more collectivity in negotiation
- Page 99 and 100: SALARY PAYMENT BASIS 90 ESTONIA LAT
- Page 101 and 102: 92 Baltic countries are often agree
- Page 103 and 104: 94 make the same purchase in Estoni
- Page 105 and 106: 96 In this way, the salary distribu
- Page 107 and 108: WOMEN'S AND MEN'S NET SALARIES, 199
- Page 109 and 110: 100 The net salaries in the private
- Page 111 and 112: 102 women's salaries have improved
- Page 113 and 114: 104 portion in 2002 measured by the
- Page 115 and 116: 106 NET WAGES AND SALARIES BY DECIL
- Page 117 and 118: 108 erage salaries have fallen by 1
- Page 119 and 120: LITHUANIA 110 The rise in consumer
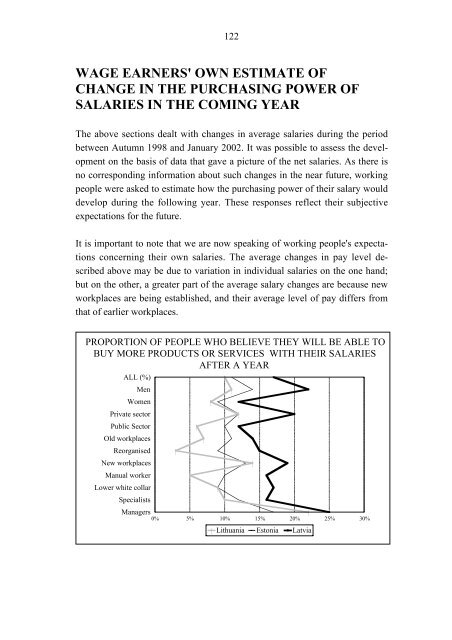
- Page 121 and 122: New workplaces Reorganised Old work
- Page 123 and 124: 114 taken into account, Lithuania's
- Page 125 and 126: 116 NET WAGES AND SALARIES BY DECIL
- Page 127 and 128: 118 In Estonia and Latvia the reorg
- Page 129: 120 MEDIAN SALARY IN 1998 AND 2002
- Page 133 and 134: 124 ing people, the managers trust
- Page 135 and 136: 126 tively small, and so their sign
- Page 137 and 138: 128 clearly higher than in the othe
- Page 139 and 140: 130 The most problematic situation
- Page 141 and 142: WEEKLY WORKING HOURS Estonia 132 Th
- Page 143 and 144: 134 mainstream in Latvia, since the
- Page 145 and 146: 136 Weekly working hours in Lithuan
- Page 147 and 148: 138 WORKING OVERTIME DURING A NORMA
- Page 149 and 150: 140 Unpaid overtime is more typical
- Page 151 and 152: 142 and why do they accept the prev
- Page 153 and 154: EMPLOYMENT CONTRACTS 144 The trends
- Page 155 and 156: 146 of no significance: in practice
- Page 157 and 158: 148 PROPORTION OF EMPLOYEES WHO HAV
- Page 159 and 160: 150 STRESS FACTORS AND CONFLICTS In
- Page 161 and 162: 152 nia has become much more demand
- Page 163 and 164: 154 Mean work intensity values (Sca
- Page 165 and 166: 60% 40% 20% 0% -20% -40% -60% Durin
- Page 167 and 168: LATVIA women men ESTONIA women men
- Page 169 and 170: 160 In 2002 in Latvia and Estonia,
- Page 171 and 172: LATVIA women men ESTONIA women men
- Page 173 and 174: 164 Work safety in Latvia is seen a
- Page 175 and 176: CONFLICTS 166 To finish this chapte
- Page 177 and 178: 168 In the question of conflicts, E
- Page 179 and 180: 170 may be a sign of efficiency; bu
- Page 181 and 182:
172 The workers' possibilities of i
- Page 183 and 184:
174 sumed that the question of sect
- Page 185 and 186:
176 two Baltic countries. This shou
- Page 187 and 188:
178 and the private sectors, though
- Page 189 and 190:
180 the individuals are allowed to
- Page 191 and 192:
JOB SATISFACTION 182 When working p
- Page 193 and 194:
100% 50% 0% -50% -100% 78% 78% -22%
- Page 195 and 196:
186 mosphere assessment between the
- Page 197 and 198:
188 aspects are enquired about: 1)
- Page 199 and 200:
190 public-sector workers are a lit
- Page 201 and 202:
192 sector, where nearly three-quar
- Page 203 and 204:
20% 15% 10% 5% 0% 15% 16% 194 THE P
- Page 205 and 206:
196 home in connection with their m
- Page 207 and 208:
198 ised by way of information netw
- Page 209 and 210:
100% 80% 60% 40% 20% 0% 200 PERSONA
- Page 211 and 212:
202 spects is (naturally) the same
- Page 213 and 214:
204 tries. Under half (43 %) of all
- Page 215 and 216:
206 The ageing workers, therefore,
- Page 217 and 218:
208 information technology are grow
- Page 219 and 220:
210 PARTICIPATED IN TRAINING PAID B
- Page 221 and 222:
212 problem category in Finland are
- Page 223 and 224:
214 DEVELOPMENT OF WORK ORGANISATIO
- Page 225 and 226:
216 of, room and opportunities shou
- Page 227 and 228:
218 been set up, with the aim of pl
- Page 229 and 230:
220 PART THREE CURRENT TRENDS AND F
- Page 231 and 232:
222 WORKING LIFE TRENDS IN ESTONIA,
- Page 233 and 234:
224 HOW HAVE ASSESSMENTS OF WORKING
- Page 235 and 236:
MEN AND WOMEN 226 The changes takin
- Page 237 and 238:
228 Greatest changes 1998 - 2002: E
- Page 239 and 240:
230 TRENDS IN ESTONIAN WORKING LIFE
- Page 241 and 242:
LATVIA 232 The attitudes of the Lat
- Page 243 and 244:
234 men have taken a somewhat more
- Page 245 and 246:
236 In the oldest age group, there
- Page 247 and 248:
Meaningfulness Equality Environment
- Page 249 and 250:
MEN AND WOMEN 240 The increased neg
- Page 251 and 252:
242 UNDER 30 YEARS Greatest changes
- Page 253 and 254:
244 trend expectations can indeed b
- Page 255 and 256:
Meaningfulness Equality Environment
- Page 257 and 258:
248 is particularly great. In the v
- Page 259 and 260:
250 EXPECTATIONS: ECONOMY OF OWN WO
- Page 261 and 262:
252 At the new workplaces establish
- Page 263 and 264:
254 DISCUSSION: DIVERGING DEVELOPME
- Page 265 and 266:
256 favourable direction and the de
- Page 267 and 268:
258 A trend toward normalisation ca
- Page 269 and 270:
260 ment staff. It is, in a way, na
- Page 271 and 272:
262 still some big changes ahead fo
- Page 273 and 274:
264 the salary due from their main
- Page 275 and 276:
266 Job satisfaction Job satisfacti
- Page 277 and 278:
REFERENCES 268 Alasoini, T.: Suomal
- Page 279 and 280:
270 http://www.stat.fi/tk/tp/maailm
- Page 290:
DATA COLLECTION AND SAMPLE DESIGN C
- Page 320 and 321:
33. Korkiasaari, Jouni: Siirtolaisi
- Page 322 and 323:
110. Aarne Mattila: Cooperation and
- Page 324 and 325:
179. Osmo Rahikainen, Pekka Ylösta
- Page 326 and 327:
243. Matti Vartiainen, Christina Sw