- Page 1 and 2: Inventing our future Collective act
- Page 3 and 4: 2 Foreword Welcome to the East of E
- Page 5 and 6: Michael Allen East of England Envir
- Page 7 and 8: Where are we now? The purpose of th
- Page 9 and 10: Where are we now? The purpose of th
- Page 11 and 12: Where are we now? Policy context 10
- Page 13 and 14: Where are we now? Long-term trends
- Page 15 and 16: Where are we now? Long-term trends
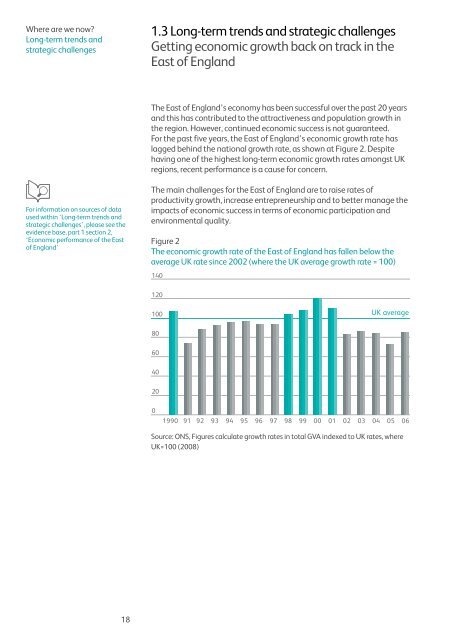
- Page 17: Where are we now? Long-term trends
- Page 21 and 22: Where are we now? Long-term trends
- Page 23 and 24: Where are we now? Long-term trends
- Page 25 and 26: Where are we now? Long-term trends
- Page 27 and 28: Where are we now? Long-term trends
- Page 29 and 30: Where are we now? Long-term trends
- Page 31 and 32: Where do we want to be? Vision 30 2
- Page 33 and 34: Where do we want to be? Headline re
- Page 35 and 36: The East of England is a great plac
- Page 37 and 38: Where do we want to be? Headline re
- Page 39 and 40: We need high-quality people so we c
- Page 41 and 42: Where do we want to be? Headline re
- Page 43 and 44: The Paper Trail is a historical ass
- Page 45 and 46: Where do we want to be? Headline re
- Page 47 and 48: Where do we want to be? Headline re
- Page 49 and 50: What do we need to change? Introduc
- Page 51 and 52: What do we need to change? Enterpri
- Page 53 and 54: What do we need to change? Enterpri
- Page 55 and 56: What do we need to change? Innovati
- Page 57 and 58: What do we need to change? Innovati
- Page 59 and 60: What do we need to change ? Digital
- Page 61 and 62: What do we need to change? Digital
- Page 63 and 64: What do we need to change ? Resourc
- Page 65 and 66: What do we need to change ? Resourc
- Page 67 and 68: Skills for Productivity Raising ski
- Page 69 and 70:
What do we need to change? Skills f
- Page 71 and 72:
Economic Participation A successful
- Page 73 and 74:
What do we need to change? Economic
- Page 75 and 76:
What do we need to change? Economic
- Page 77 and 78:
What do we need to change? Transpor
- Page 79 and 80:
What do we need to change? Transpor
- Page 81 and 82:
What do we need to change? Transpor
- Page 83 and 84:
What do we need to change? Spatial
- Page 85 and 86:
What do we need to change? Spatial
- Page 87 and 88:
What do we need to change? Spatial
- Page 89 and 90:
What do we need to change? The spat
- Page 91 and 92:
What do we need to change? The spat
- Page 93 and 94:
What do we need to change? The spat
- Page 95 and 96:
What do we need to change? The spat
- Page 97 and 98:
What do we need to change? The spat
- Page 99 and 100:
What do we need to change? The spat
- Page 101 and 102:
What do we need to change? The spat
- Page 103 and 104:
What do we need to change? The spat
- Page 105 and 106:
What do we need to change? The spat
- Page 107 and 108:
What do we need to change? The spat
- Page 109 and 110:
What do we need to change? The spat
- Page 111 and 112:
What do we need to change? The spat
- Page 113 and 114:
How do we get there? Leadership, go
- Page 115 and 116:
How do we get there? Leadership, go
- Page 117 and 118:
People’s health and well-being ar
- Page 119 and 120:
How do we get there? Leadership, go
- Page 121 and 122:
How do we get there? Leadership, go
- Page 123 and 124:
How do we get there? Leadership, go
- Page 125 and 126:
Improving health in the workplace i
- Page 127 and 128:
How do we get there? Monitoring 126
- Page 129 and 130:
Business Link East is committed to
- Page 131 and 132:
Indicators linked to RES goals Digi
- Page 133 and 134:
Our location is an amazing natural
- Page 135 and 136:
Indicators linked to RES goals Econ
- Page 137 and 138:
Thurrock is a growth area of nation
- Page 139 and 140:
Climate change and sustainability a
- Page 141 and 142:
Appendices Underlying principles Su
- Page 143 and 144:
Appendices Underlying principles Su
- Page 145 and 146:
Appendices Underlying principles Su
- Page 147 and 148:
Appendices Key terms 146 ecosystems
- Page 149 and 150:
Appendices Key terms 148 market fai
- Page 151 and 152:
Appendices Key terms 150 social exc
- Page 153 and 154:
Appendices Acronyms 152 NVQ nationa
- Page 155 and 156:
Appendices List of stakeholders inv
- Page 157 and 158:
Appendices List of stakeholders inv
- Page 159 and 160:
OUR ENVIRONMENT, OUR FUTURE THE REG
- Page 161 and 162:
Further Information If you have que
- Page 163 and 164:
6 The Regional Environment Strategy
- Page 165 and 166:
The Landscape and Natural Environme
- Page 167 and 168:
The Landscape and Natural Environme
- Page 169 and 170:
The Historic and Built Environment
- Page 171 and 172:
The Historic and Built Environment
- Page 173 and 174:
Natural Resources One of the major
- Page 175 and 176:
Natural Resources 30 The Regional E
- Page 177 and 178:
Meeting the Environmental Challenge
- Page 179 and 180:
Meeting the Environmental Challenge
- Page 181 and 182:
Meeting the Environmental Challenge
- Page 183 and 184:
Meeting the Environmental Challenge
- Page 185 and 186:
Meeting the Environmental Challenge
- Page 187 and 188:
Meeting the Environmental Challenge
- Page 189 and 190:
Meeting the Environmental Challenge
- Page 191 and 192:
The Way Forward SA6: Harness enviro
- Page 193 and 194:
The Way Forward Integrate environme
- Page 195 and 196:
Appendix 2 - Acknowledgements Peter
- Page 197:
Appendix 3 - Other Regional Strateg
- Page 201 and 202:
If you would like copies of this do
- Page 204:
Contents Preface 07 Executive summa
- Page 208 and 209:
Executive summary Introduction and
- Page 210 and 211:
• Strategic Priority 3: To make i
- Page 212:
Figure 1: Healthy Futures - The Reg
- Page 215 and 216:
16 1.4 These same issues also have
- Page 218 and 219:
02 Policy context for Healthy Futur
- Page 220 and 221:
• Food and Health Action Plan: th
- Page 222:
Section A: The health of people in
- Page 225 and 226:
26 Figure 3.1: Comparative projecte
- Page 227 and 228:
28 Figure 3.3: Trend in female life
- Page 229 and 230:
30 Figure 3.5: Proportion of wards
- Page 231 and 232:
32 Figure 3.6: Life expectancy, cha
- Page 233 and 234:
34 3.11 Looking together at Figure
- Page 235 and 236:
36 Figure 3.10: Self-reported healt
- Page 237 and 238:
38 mortality rate which is more tha
- Page 240 and 241:
04 Understanding the health of peop
- Page 242 and 243:
I: General socio-economic, cultural
- Page 244 and 245:
Worklessness in the East of England
- Page 246 and 247:
proportions in recently urbanised p
- Page 248 and 249:
4.31 The housing stock within the E
- Page 250 and 251:
4.39 For the East of England, the i
- Page 252 and 253:
Alcohol 4.50 Alcohol can cause sign
- Page 254:
Social and community networks Lifes
- Page 258 and 259:
05 Healthy Futures: the strategy Ch
- Page 260 and 261:
Figure 5.1: Male Life Expectancy in
- Page 262:
Figure 5.2: Healthy Futures: the Re
- Page 265 and 266:
66 6.2 In the East of England, ther
- Page 267 and 268:
68 Designing Health into Sustainabl
- Page 269 and 270:
70 Strategic Priority 1: To ensure
- Page 271 and 272:
72 Strategic Priority 2: To provide
- Page 273 and 274:
74 Support group for first generati
- Page 275 and 276:
76 Strategic Priority 2: To provide
- Page 277 and 278:
78 Strategic Priority 3: To make it
- Page 279 and 280:
80 Strategic Priority 3: To make it
- Page 282 and 283:
07 Theme B: Health at Key Life Stag
- Page 284 and 285:
7.5 Within this overall context - a
- Page 286 and 287:
7.9 Taken as a whole, the NSF for c
- Page 288 and 289:
Timescale Suggested lead partner(s)
- Page 290 and 291:
(ii) Workplaces 7.15 The nature of
- Page 292 and 293:
A Regional Health Strategy for the
- Page 294 and 295:
Timescale Suggested lead partner(s)
- Page 296 and 297:
7.29 However, older people also fac
- Page 298 and 299:
Learning for Older People - Into IT
- Page 300 and 301:
Timescale Suggested lead partner(s)
- Page 302 and 303:
08 Theme C: Health in A Connected R
- Page 304 and 305:
Norfolk Tobacco Alliance Smoke Free
- Page 306 and 307:
8.10 Improving knowledge with regar
- Page 308 and 309:
Climate change, health and the work
- Page 310 and 311:
Timescale Suggested lead partner(s)
- Page 312 and 313:
09 Delivering Healthy Futures Chapt
- Page 314 and 315:
Figure 9.2: Read-across between exi
- Page 316 and 317:
3) Delivery processes for local and
- Page 318 and 319:
Annex A: Consultation process A Reg
- Page 320 and 321:
4) Action Planning Workshops During
- Page 322 and 323:
Annex B: Links between Healthy Futu
- Page 324 and 325:
B: Other PSA Targets (from SR2004)
- Page 326 and 327:
28) Improve children’s communicat
- Page 328 and 329:
Annex C: Glossary A Regional Health
- Page 330 and 331:
IiC Investing in Communities A cata
- Page 332 and 333:
Annex D: Bibliography A Regional He
- Page 334 and 335:
Independent inquiry into inequaliti
- Page 337 and 338:
East of England Regional Assembly F
- Page 339 and 340:
Regional Housing Strategy East of E
- Page 341 and 342:
2 Executive summary Introduction Th
- Page 343 and 344:
High quality homes and environments
- Page 345 and 346:
2 Contents Regional Housing Strateg
- Page 347 and 348:
3 Introduction Regional Housing Str
- Page 349 and 350:
4 Purpose and Vision Purpose Region
- Page 351 and 352:
• PSA 7: by 2010, bring all socia
- Page 353 and 354:
Figure 2. Elements of the integrate
- Page 355 and 356:
Housing investment sub-regions Regi
- Page 357 and 358:
• recognise the need to bring for
- Page 359 and 360:
Regional Housing Strategy for the E
- Page 361 and 362:
Regional Housing Strategy for the E
- Page 363 and 364:
• Section 106 discussions held at
- Page 365 and 366:
currently underway and due to repor
- Page 367 and 368:
Sustainable provision Regional Hous
- Page 369 and 370:
6 High quality homes and environmen
- Page 371 and 372:
Regional Housing Strategy for the E
- Page 373 and 374:
6.41 Policy SS11 in the East of Eng
- Page 375 and 376:
Housing to improve health and well-
- Page 377 and 378:
Regional Housing Strategy for the E
- Page 379 and 380:
7 Creating inclusive communities As
- Page 381 and 382:
7.20 The report reveals that there
- Page 383 and 384:
Regional Housing Strategy for the E
- Page 385 and 386:
7.43 The scheme is not about settin
- Page 387 and 388:
Rural communities Need for housing
- Page 389 and 390:
7.67 The RHDG will ensure that the
- Page 391 and 392:
7.80 The RHDG will ensure that the
- Page 393 and 394:
7.88 Visiting or floating support,
- Page 395 and 396:
8 Recommendations for public invest
- Page 397 and 398:
The balance between investment in e
- Page 399 and 400:
Empty homes 8.22 There will always
- Page 401 and 402:
normally be able to move to full ow
- Page 403 and 404:
8.46 Housing schemes which do not a
- Page 405 and 406:
Theme Strategic outcome Typical sch
- Page 407 and 408:
Options Appraisals and achieve the
- Page 409 and 410:
8.70 Investment under this theme sh
- Page 411 and 412:
8.85 In the longer-term, the limite
- Page 413 and 414:
Geographical targeting of investmen
- Page 415 and 416:
Delivery at local level 9.8 The bro
- Page 417 and 418:
9.22 The responsibility for managin
- Page 419 and 420:
Actions to be scheduled and priorit
- Page 421 and 422:
Action Regional Housing Strategy fo
- Page 423:
List of Abbreviations ACER Associat
- Page 426 and 427:
2 Foreword 5 Achievements of the st
- Page 429 and 430:
Foreword Regional Social Strategy -
- Page 431 and 432:
Regional Social Strategy - the stra
- Page 433 and 434:
Regional Social Strategy - the stra
- Page 435 and 436:
Regional Social Strategy - the stra
- Page 437 and 438:
Regional Social Strategy - the stra
- Page 439 and 440:
Regional Social Strategy - the stra
- Page 441 and 442:
Regional Social Strategy - the stra
- Page 443 and 444:
Regional Social Strategy - the stra
- Page 445 and 446:
Regional Social Strategy - the stra
- Page 447 and 448:
Regional Social Strategy - the stra
- Page 449 and 450:
Regional Social Strategy - the stra
- Page 451 and 452:
Regional Social Strategy - the stra
- Page 453 and 454:
Regional Social Strategy - the stra
- Page 455 and 456:
Regional Social Strategy - the stra
- Page 457 and 458:
Regional Social Strategy - the stra
- Page 459 and 460:
Regional Social Strategy - the stra
- Page 461 and 462:
Regional Social Strategy - the stra
- Page 463 and 464:
Regional Social Strategy - the stra
- Page 465 and 466:
Regional Social Strategy - the stra
- Page 467 and 468:
Regional Social Strategy - the stra
- Page 469 and 470:
Regional Social Strategy - the stra
- Page 471 and 472:
Regional Social Strategy - the stra
- Page 473 and 474:
Case study 1 Regional Social Strate
- Page 475 and 476:
Case study 3 Regional Social Strate
- Page 477 and 478:
Regional Social Strategy - the stra
- Page 479 and 480:
Case study 7 Policy context Regiona
- Page 481 and 482:
Regional Social Strategy - the stra
- Page 483 and 484:
Regional Social Strategy - the stra
- Page 485 and 486:
ii) Child poverty Regional Social S
- Page 487 and 488:
Regional Social Strategy - the stra
- Page 489 and 490:
Regional Social Strategy - the stra
- Page 491 and 492:
Regional Social Strategy - the stra
- Page 493 and 494:
Regional Social Strategy - the stra
- Page 495 and 496:
Regional Social Strategy - the stra
- Page 497 and 498:
Regional Social Strategy - the stra
- Page 499 and 500:
Regional Social Strategy - the stra
- Page 501 and 502:
Regional Social Strategy - the stra
- Page 503 and 504:
Regional Social Strategy - the stra
- Page 505 and 506:
Regional Social Strategy - the stra
- Page 507 and 508:
Regional Social Strategy - the stra
- Page 509 and 510:
Regional Social Strategy - the stra
- Page 511 and 512:
Regional Social Strategy - the stra
- Page 513 and 514:
Regional Social Strategy - the stra
- Page 515 and 516:
Regional Social Strategy - the stra
- Page 517 and 518:
Regional Social Strategy - the stra
- Page 519 and 520:
Action plan Regional Social Strateg
- Page 521 and 522:
Regional Social Strategy - the stra
- Page 523:
Photographs Regional Social Strateg