- Page 1 and 2: Inventing our future Collective act
- Page 3 and 4: 2 Foreword Welcome to the East of E
- Page 5 and 6: Michael Allen East of England Envir
- Page 7 and 8: Where are we now? The purpose of th
- Page 9 and 10: Where are we now? The purpose of th
- Page 11 and 12: Where are we now? Policy context 10
- Page 13 and 14: Where are we now? Long-term trends
- Page 15 and 16: Where are we now? Long-term trends
- Page 17: Where are we now? Long-term trends
- Page 20 and 21: Where are we now? Long-term trends
- Page 22 and 23: Where are we now? Long-term trends
- Page 24 and 25: Where are we now? Long-term trends
- Page 26 and 27: Where are we now? Long-term trends
- Page 28 and 29: Where are we now? Long-term trends
- Page 30 and 31: Where do we want to be? 2.1 Vision
- Page 32 and 33: Where do we want to be? Headline re
- Page 34 and 35: In the future, people in business w
- Page 38 and 39: Our future in the East of England,
- Page 40 and 41: Where do we want to be? Headline re
- Page 42 and 43: The best way to nurture gifted youn
- Page 44 and 45: Where do we want to be? Headline re
- Page 46 and 47: Managers need to embrace the idea o
- Page 48 and 49: What do we need to change? 3.1 Ente
- Page 50 and 51: Enterprise Enterprises are the hear
- Page 52 and 53: What do we need to change? Enterpri
- Page 54 and 55: Innovation Innovation - the success
- Page 56 and 57: What do we need to change? Innovati
- Page 58 and 59: Digital Economy Digital technologie
- Page 60 and 61: What do we need to change? Digital
- Page 62 and 63: Resource Efficiency Getting more fr
- Page 64 and 65: What do we need to change ? Resourc
- Page 66 and 67: What do we need to change ? Resourc
- Page 68 and 69: What do we need to change? Skills f
- Page 70 and 71: What do we need to change? Skills f
- Page 72 and 73: What do we need to change? Economic
- Page 74 and 75: What do we need to change? Economic
- Page 76 and 77: Transport A transport system that e
- Page 78 and 79: What do we need to change? Transpor
- Page 80 and 81: What do we need to change? Transpor
- Page 82 and 83: Spatial Economy High-quality and di
- Page 84 and 85: What do we need to change? Spatial
- Page 86 and 87:
What do we need to change? Spatial
- Page 88 and 89:
What do we need to change? The spat
- Page 90 and 91:
What do we need to change? The spat
- Page 92 and 93:
What do we need to change? The spat
- Page 94 and 95:
What do we need to change? The spat
- Page 96 and 97:
What do we need to change? The spat
- Page 98 and 99:
What do we need to change? The spat
- Page 100 and 101:
What do we need to change? The spat
- Page 102 and 103:
What do we need to change? The spat
- Page 104 and 105:
What do we need to change? The spat
- Page 106 and 107:
What do we need to change? The spat
- Page 108 and 109:
What do we need to change? The spat
- Page 110 and 111:
What do we need to change? The spat
- Page 112 and 113:
How do we get there? 4.1 Leadership
- Page 114 and 115:
How do we get there? Leadership, go
- Page 116 and 117:
Our universities’ interaction wit
- Page 118 and 119:
How do we get there? Leadership, go
- Page 120 and 121:
Peterborough plays a significant ro
- Page 122 and 123:
How do we get there? Leadership, go
- Page 124 and 125:
We aim to make the East of England
- Page 126 and 127:
How do we get there? Leadership, go
- Page 128 and 129:
How do we get there? Monitoring Hea
- Page 130 and 131:
Indicators linked to RES goals Ente
- Page 132 and 133:
From soca to steel pan, mas to new
- Page 134 and 135:
Indicators linked to RES goals Reso
- Page 136 and 137:
Indicators linked to RES goals Tran
- Page 138 and 139:
How do we get there? Monitoring 2.
- Page 140 and 141:
Appendices 5.1 Underlying principle
- Page 142 and 143:
Appendices Underlying principles Su
- Page 144 and 145:
Appendices Underlying principles Su
- Page 146 and 147:
Appendices Key terms 145 5.2 Key te
- Page 148 and 149:
Appendices Key terms 147 Integrated
- Page 150 and 151:
Appendices Key terms 149 qualificat
- Page 152 and 153:
Appendices Acronyms 151 5.3 Acronym
- Page 154 and 155:
Appendices List of stakeholders inv
- Page 156 and 157:
Appendices List of stakeholders inv
- Page 158 and 159:
If you know anyone who needs this d
- Page 160 and 161:
‘OUR ENVIRONMENT, OUR FUTURE’ T
- Page 162 and 163:
CONTENTS 1 Introduction 11 1.1 Why
- Page 164 and 165:
Introduction 1.2 PURPOSE OF THE ENV
- Page 166 and 167:
The Landscape and Natural Environme
- Page 168 and 169:
The Historic and Built Environment
- Page 170 and 171:
The Historic and Built Environment
- Page 172 and 173:
Natural Resources • Surface Water
- Page 174 and 175:
Natural Resources Mineral extractio
- Page 176 and 177:
Meeting the Environmental Challenge
- Page 178 and 179:
Meeting the Environmental Challenge
- Page 180 and 181:
Meeting the Environmental Challenge
- Page 182 and 183:
Meeting the Environmental Challenge
- Page 184 and 185:
Meeting the Environmental Challenge
- Page 186 and 187:
Meeting the Environmental Challenge
- Page 188 and 189:
Meeting the Environmental Challenge
- Page 190 and 191:
The Way Forward 6.1 DELIVERING SUST
- Page 192 and 193:
The Way Forward SA11: Enhance biodi
- Page 194 and 195:
Appendix 1 - Bibliography Power of
- Page 196 and 197:
Appendix 3 - Other Regional Strateg
- Page 200 and 201:
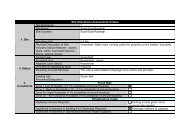
HealthyFutures A Regional Health St
- Page 202:
HealthyFutures A Regional Health St
- Page 206:
Preface I am delighted to introduce
- Page 209 and 210:
10 6 What actually determines the h
- Page 211 and 212:
12 Delivering Healthy Futures 11 Gi
- Page 214 and 215:
01 Introduction Chapter summary Hea
- Page 216:
What the Strategy does not address
- Page 219 and 220:
20 2.5 Against this backdrop, the W
- Page 221 and 222:
22 Figure 2.1: Sustainable Futures:
- Page 224 and 225:
03 Describing the health of people
- Page 226 and 227:
Figure 3.2: Projected trends in old
- Page 228 and 229:
Figure 3.4: Trend in male life expe
- Page 230 and 231:
3.7 In 2001, the incidence of all c
- Page 232 and 233:
Local Authority Male Female Male Fe
- Page 234 and 235:
Figure 3.8: Unemployment Index of M
- Page 236 and 237:
Figure 3.12: Male life expectancy M
- Page 238:
Conclusions 3.19 Across the East of
- Page 241 and 242:
42 Figure 4.1: The main determinant
- Page 243 and 244:
44 The changing experience of group
- Page 245 and 246:
46 4.18 There is a direct relations
- Page 247 and 248:
48 Working and learning environment
- Page 249 and 250:
50 Access to health care and other
- Page 251 and 252:
52 Diet ‘People in lower socio-ec
- Page 253 and 254:
54 Figure 4.2: Summary table highli
- Page 256:
Section B: Healthy Futures: Regiona
- Page 259 and 260:
60 5.4 Healthy Futures has a number
- Page 261 and 262:
62 5.10 In response there is a need
- Page 264 and 265:
06 Theme A: Health in Sustainable C
- Page 266 and 267:
• Acknowledge the potential links
- Page 268 and 269:
Sustainable transport and health -
- Page 270 and 271:
Timescale Suggested lead partner(s)
- Page 272 and 273:
6.11 Against this backdrop, there i
- Page 274 and 275:
Young people, volunteering, social
- Page 276 and 277:
Timescale Suggested lead partner(s)
- Page 278 and 279:
6.18 In addition, there are real op
- Page 280:
Timescale Suggested lead partner(s)
- Page 283 and 284:
84 Nationally, the early years work
- Page 285 and 286:
86 7.7 The agenda with regard to ch
- Page 287 and 288:
88 Strategic Priority 4: To ensure
- Page 289 and 290:
90 Strategic Priority 5: To encoura
- Page 291 and 292:
92 (iii) Issues relating to life-wo
- Page 293 and 294:
94 Strategic Priority 5: To encoura
- Page 295 and 296:
96 Strategic Priority 6: To support
- Page 297 and 298:
98 Town and Bridge Project: Improvi
- Page 299 and 300:
100 Strategic Priority 6: To suppor
- Page 301 and 302:
102
- Page 303 and 304:
104 people seeking asylum and refug
- Page 305 and 306:
106 Strategic Priority 8: To harnes
- Page 307 and 308:
108 Strategic Priority 9: To unders
- Page 309 and 310:
110 Strategic Priority 9: To unders
- Page 311 and 312:
112
- Page 313 and 314:
116 Figure 9.1: Delivering Healthy
- Page 315 and 316:
118 Strategy Date published 2004 20
- Page 317 and 318:
120
- Page 319 and 320:
122 Consultation process Overview O
- Page 321 and 322:
124
- Page 323 and 324:
126 Links between Healthy Futures a
- Page 325 and 326:
128 • Improving the basic skill l
- Page 327 and 328:
130 C: Other PSA Targets (from SR20
- Page 329 and 330:
132 Active ageing This is defined b
- Page 331 and 332:
134 Social Capital Defined as ‘th
- Page 333 and 334:
136 Bibliography A Shared Vision: T
- Page 335:
138 The CHD National Service Framew
- Page 338 and 339:
Regional Housing Strategy for the E
- Page 340 and 341:
2 1 Foreword I am very pleased to i
- Page 342 and 343:
4 For the foreseeable future, most
- Page 344 and 345:
6 Recommendations for public invest
- Page 346 and 347:
8 8 Recommendations for public inve
- Page 348 and 349:
10 3.12 There are considerable diff
- Page 350 and 351:
12 Figure 1. Relationships between
- Page 352 and 353:
14 The regional strategic framework
- Page 354 and 355:
16 4.25 In preparing the East of En
- Page 356 and 357:
18 Each of these sub-regions has a
- Page 358 and 359:
20 5 More, sustainable housing prov
- Page 360 and 361:
22 Strategic policy: planning frame
- Page 362 and 363:
24 5.28 Partnering: the principle o
- Page 364 and 365:
26 5.40 EEDA, the development indus
- Page 366 and 367:
28 5.54 Local Authorities: local au
- Page 368 and 369:
30 5.62 EEDA has a key role to play
- Page 370 and 371:
32 6.10 Quality applies as much to
- Page 372 and 373:
34 6.31 The EERA/RHB must ensure th
- Page 374 and 375:
36 6.53 The EERA/RHB will encourage
- Page 376 and 377:
38 6.63 There are three levels of a
- Page 378 and 379:
40 Figure 8. Policy framework: hous
- Page 380 and 381:
42 7.10 Barriers to achieving more
- Page 382 and 383:
44 raising awareness of refugees as
- Page 384 and 385:
46 Providing mixed communities and
- Page 386 and 387:
48 Figure 10. Policy framework: pro
- Page 388 and 389:
50 Supply of affordable housing 7.5
- Page 390 and 391:
52 Homelessness 7.69 Rising levels
- Page 392 and 393:
54 Supporting people 7.82 ’Suppor
- Page 394 and 395:
56 7.95 There is a lack of detailed
- Page 396 and 397:
58 8.4 The most significant source
- Page 398 and 399:
60 8.14 The Decent Homes Standard i
- Page 400 and 401:
62 Disabled Facilities Grants 8.30
- Page 402 and 403:
64 recommended in national guidance
- Page 404 and 405:
66 Figure 17. Investment themes The
- Page 406 and 407:
68 Thematic targeting of investment
- Page 408 and 409:
70 Growth 8.61 Three of the Growth
- Page 410 and 411:
72 8.77 Similarly, although much pr
- Page 412 and 413:
74 8.94 This is not necessarily abo
- Page 414 and 415:
76 9 Implementation, managing and m
- Page 416 and 417:
78 Monitoring and review of the RHS
- Page 418 and 419:
80 Strategic risk Operational risk
- Page 420 and 421:
82 Action Regional housing provider
- Page 422 and 423:
84 10 Appendix Appendix 1 - deliver
- Page 425 and 426:
Regional Social Strategy the strate
- Page 427:
Regional Social Strategy - the stra
- Page 430 and 431:
6 Achievements of the strategy to d
- Page 432 and 433:
8 Achievements of the strategy to d
- Page 434 and 435:
10 Chapter 1 - Vision, aims & objec
- Page 436 and 437:
12 Chapter 1 - Vision, aims & objec
- Page 438 and 439:
14 Chapter 1 - Vision, aims & objec
- Page 440 and 441:
16 Chapter 2 - An overview of socia
- Page 442 and 443:
18 Chapter 2 - An overview of socia
- Page 444 and 445:
20 Chapter 2 - An overview of socia
- Page 446 and 447:
22 Chapter 2 - An overview of socia
- Page 448 and 449:
24 Chapter 2 - An overview of socia
- Page 450 and 451:
26 Chapter 2 - An overview of socia
- Page 452 and 453:
28 Chapter 2 - An overview of socia
- Page 454 and 455:
30 Chapter 2 - An overview of socia
- Page 456 and 457:
32 Chapter 2 - An overview of socia
- Page 458 and 459:
34 Chapter 2 - An overview of socia
- Page 460 and 461:
36 Chapter 2 - An overview of socia
- Page 462 and 463:
38 Chapter 2 - An overview of socia
- Page 464 and 465:
40 Chapter 2 - An overview of socia
- Page 466 and 467:
42 Chapter 2 - An overview of socia
- Page 468 and 469:
44 Chapter 2 - An overview of socia
- Page 470 and 471:
46 Chapter 2 - An overview of socia
- Page 472 and 473:
48 Chapter 3 - Effective interventi
- Page 474 and 475:
50 Chapter 3 - Effective interventi
- Page 476 and 477:
52 Chapter 3 - Effective interventi
- Page 478 and 479:
54 Chapter 3 - Effective interventi
- Page 480 and 481:
56 Chapter 3 - Effective interventi
- Page 482 and 483:
58 Chapter 3 - Effective interventi
- Page 484 and 485:
60 Chapter 3 - Effective interventi
- Page 486 and 487:
62 Chapter 3 - Effective interventi
- Page 488 and 489:
64 Chapter 3 - Effective interventi
- Page 490 and 491:
66 Chapter 3 - Effective interventi
- Page 492 and 493:
68 Chapter 3 - Effective interventi
- Page 494 and 495:
70 Chapter 3 - Effective interventi
- Page 496 and 497:
72 Chapter 3 - Effective interventi
- Page 498 and 499:
74 Chapter 3 - Effective interventi
- Page 500 and 501:
76 Chapter 3 - Effective interventi
- Page 502 and 503:
78 Chapter 3 - Effective interventi
- Page 504 and 505:
80 Chapter 3 - Effective interventi
- Page 506 and 507:
82 Chapter 3 - Effective interventi
- Page 508 and 509:
84 Chapter 3 - Effective interventi
- Page 510 and 511:
86 Chapter 3 - Effective interventi
- Page 512 and 513:
88 Chapter 3 - Effective interventi
- Page 514 and 515:
90 Chapter 3 - Effective interventi
- Page 516 and 517:
92 Chapter 3 - Effective interventi
- Page 518 and 519:
94 Chapter 3 - Effective interventi
- Page 520 and 521:
96 Glossary Glossary BME Black and
- Page 522 and 523:
98 Acknowledgements Acknowledgement
- Page 525:
Printed on 9lives 55 Silk; an FSC a